Getting Started with Interactive Blazor Charts

In the 2020 v2 release of ComponentOne, we’ve introduced two new data visualization components for Blazor: FlexChart and FlexPie. This article provides a quick intro to the FlexChart, a visual component that creates a large number of Cartesian plots, including column, bar, line, scatter, area, and step charts.
Read the full ComponentOne 2020 v2 release.
Blazor and WebAssembly
Blazor is a new and promising platform for web UI development. At this moment there are two Blazor flavors that differ by hosting environments (there might be more coming but they’re in early stages of development). Both of them are quite interesting:
- Blazor Server - runs on the server and communicates with the browser via a special SignalR library.
- Blazor Client (Blazor WebAssembly) - runs directly in the browser, with .NET code executed in the browser by runtime implemented in WebAssembly.
FlexChart Blazor Development
For me, it was especially interesting to work with Blazor since it lies somewhere between two technological continents I am used to working with recently: C#/ .NET and client-side JavaScript.
Below are several notes and impressions about the component's development for Blazor.
- First of all, it’s .NET, so a lot of code works fine here. We were able to easily adapt our common core charting engine that is shared between other .NET platforms (WinForms and WPF).
- As a rendering target SVG is an obvious choice for charting component since it provides fast and high-quality vector graphics as well as perfect compatibility across browsers and platforms.
- The Blazor components which are actually the same as Razor components can work in both Blazor environments (Server and WebAssembly). They are created and initialized on Razor pages that have a special markup syntax. To create a Blazor component you need to inherit your component for ComponentBase class, add parameter attribute to the properties which should be set in markup and, of course, provide content for rendering.
- You still need to use a JavaScript interop quite extensively to get interactive and responsive components. That was expected since the final rendering and UI belong to the browser.
Quick Blazor Sample
Let's move on to the real code and try to make our first Blazor chart.
1. Create Blazor Project
Open Visual Studio, create a new project, then select BlazorApp template:

In the next step, you can set the name and the location of the project. And in the last step, you choose the type of application: Server or WebAssembly (Client).

Let’s click next and generate a Blazor Server application. The project created by this template has several pages, obviously the most suited for us is the page FetchData that contains HTML table receiving data from simple web service. All we need is to replace the table on the page with a chart.
2. Add FlexChart’s Package.
Right-click on the project in solution explorer and select “Manage NuGet packages..”. Find and install C1.Blazor.Chart package.
3. Add Client JavaScript.
The chart, as well as any more or less complex Blazor component, requires some support from client JavaScript. Now you need to add a reference manually.
Open _Host.cshtml file in Pages folder and add the following line at the end of <head> section:
<script src="~/_content/C1.Blazor.Chart/scripts.js"></script>
4. Replace Grid with Chart.
Open page FetchData.razor in Pages folder, remove <table> tag, add using statement at the beginning:
@using C1.Chart
@using C1.Blazor.Chart
and insert the following chart definition:
FetchData.razor
<FlexChart ItemsSource="forecasts" BindingX="Date">
     <SeriesCollection>
           <Series Binding="TemperatureC" />
     </SeriesCollection>
</FlexChart>
This declaration creates a chart component and sets its main properties related to data-binding:
-
ItemsSource - data source collection.
-
BindingX - values shown along x-axis.
-
Binding - values shown along y-axis.
We can already run the project, open Data Fetch page, and see something like this:

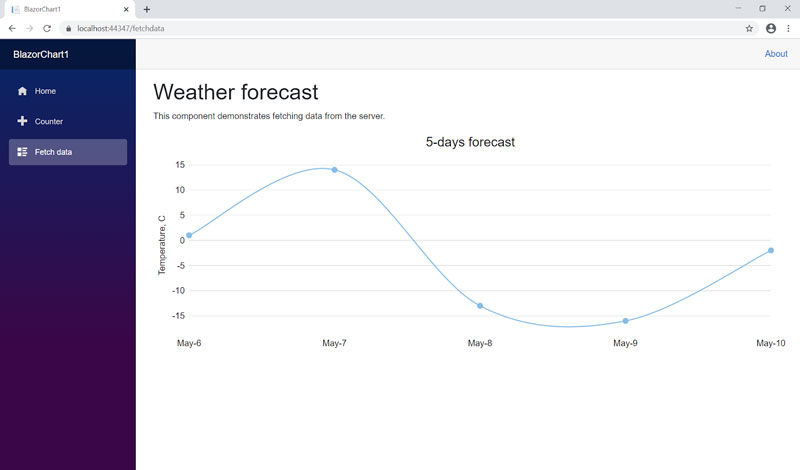
To make the chart a bit nicer, we can add a header, apply some formatting to the axes, and change the chart type to smooth lines (ChartType.SplineSymbols):
FetchData.razor
<FlexChart ItemsSource="forecasts" BindingX="Date" ChartType="ChartType.SplineSymbols" HeaderContent="5-days forecast" HeaderStyle="font-size:24px">
    <SeriesCollection>
        <Series Binding="TemperatureC"/>
    </SeriesCollection>
    <AxisCollection>
        <Axis AxisType="AxisType.X" Position="Position.Bottom" AxisLine="false" Format="MMM-d" MajorTickMarks="TickMark.None"/>
        <Axis AxisType="AxisType.Y" Position="Position.Left" Title="Temperature, C" AxisLine="false" MajorTickMarks="TickMark.None" MajorGrid="true"/>
    </AxisCollection>
</FlexChart>
The chart should like this:
We can also use CSS for the chart customization. Add this chart rule to the site.css:
site.css
.chart {
    width: 100%;
    height: 320px;
    padding: 15px 10px;
    border: 1px solid #e4e4e4;
}
And set the Class attribute for the chart:
<FlexChart Class="chart" .. >
The final result would be the following:

Adding Real Data
The chart created in the previous section uses fake static data but it’s much more interesting to work with real data. First of all, we need data. Recently, I’ve found a good weather data source:
https://worldweather.wmo.int/en/dataguide.html
It provides historical average weather data for many cities as a short-term forecast. Let's build a chart that shows the average monthly temperatures for two cities.
1. Add the Required Packages
The data is returned as JSON so at first, we need to parse it. Let's install the System.NET.Http.Json package that has several nice extension methods that would be useful.
2. Create a Data Service
It's always handy to map the parsed JSON data to C# classes. I believe there are a lot of ways to do that. I just used the first online tool I found. Based on a sample JSON I generated the C# classes, cleaned them up, and added some parsing and conversion for convenience. The most important class for data binding contains average temperature data for a month.
ClimateService.cs
public class ClimateMonth
{
    public int month { get; set; }
    public string maxTemp { get; set; }
    public string minTemp { get; set; }

    public double MaxT { get { return double.Parse(maxTemp); } }
    public double MinT { get { return double.Parse(minTemp); } }
    public string MonthShort
    {
        get { return CultureInfo.CurrentCulture.DateTimeFormat.AbbreviatedMonthNames[month - 1]; }
    }
}
Then I created a simple web service that gets climate data by city name. The main method requests data from worldweather.wmo.int and returns them as a list of monthly averages (class ClimateMonth) for the specified city.
ClimateService.cs
public async Task<List<ClimateMonth>> GetClimateData(string city)
{
    int code = GetCityCode(city);
    if (code!=0)
    {
        var root = await Http.GetFromJsonAsync<Root>( string.Format("https://worldweather.wmo.int/en/json/{0}_en.json", code));
        return root.city.climate.climateMonth;
    } else
        return null;
}
3. Setup Chart
Now we are ready to create the chart. Let's make a new page Climate.razor for this. The code is quite simple, here is the whole page:
Climate.razor
@page "/climate"

@using C1.Chart
@using C1.Blazor.Chart
@using BlazorApp5.Data
@inject ClimateService ClimateService

<h1>City Climate Comparision</h1>

@if (climateData1 == null && climateData2 == null)
{
    <p><em>Loading...</em></p>
}
else
{
    <FlexChart class="chart" ChartType="ChartType.Area" ItemsSource="climateData1" BindingX="MonthShort" Binding="MinT,MaxT"
               HeaderContent="Average temperature (°C) by month" HeaderStyle="font-size:24px">
        <SeriesCollection>
            <Series Name="@city1" />
            <Series Name="@city2" ItemsSource="climateData2"/>
        </SeriesCollection>
    </FlexChart>
}
@code {
    private string city1 = "Singapore";
    private List<ClimateMonth> climateData1;
    private string city2 = "New York City";
    private List<ClimateMonth> climateData2;
    protected override async Task OnInitializedAsync()
    {
        climateData1 = await ClimateService.GetClimateData(city1);
        climateData2 = await ClimateService.GetClimateData(city2);
    }
}
It injects our date service to the page, created a chart with two series, and loads the data in OnIntializedAsync() method. Please notice it's a range area plot and we specify two comma-separated properties for binding, one for minimum value and one for maximum: Binding="MinT,MaxT".
After adding the page to the navigator in Shared\NavMenu.razor file:
<div class="@NavMenuCssClass" @onclick="ToggleNavMenu">
    <ul class="nav flex-column">
       ...
        <li class="nav-item px-3">
            <NavLink class="nav-link" href="climate">
                <span class="oi oi-list-rich" aria-hidden="true"></span> City Climate
            </NavLink>
        </li>
    </ul>
</div>
We are ready to run the project, open the “City Climate” page and you should see the following chart:

We can add a couple of combo boxes for city selection and have a nice tool to quickly compare monthly temperatures in two cities.

The sample project can be found here: BlazorChart.zip
Future of Blazor Charts
In future releases, we plan to achieve the same features and charting functionality as offered with the other platforms (WinForms and WPF).

Alex Trefilov