Last time we described the methodology about .NET 5 and .NET Framework 4.5.2 WinForms controls comparison based on our FlexGrid control. This time we share the results of comparison of different common FlexGrid operations. The same methodology can be applied for .NET 6 when it releases on November 9th, 2021.
Benchmarks
We provide some descriptive information about the testing method, the source code for the benchmark method, the summary table with measurements, density plots, and information about the gathered results for our benchmark tests. We provide information and code snippets if the benchmark contains some additional setup.
All benchmarks’ source files can be found attached to this blog post archive with the whole application.
Each benchmark source file contains all operations except data generation to understand what is going on without needing to switch to another file.
Generating and Assigning Data
Our first benchmark method measures data generation and assigning it to FlexGrid – DataTable as the data source and DataMaps for specific columns.
For this benchmark, we don’t have GlobalSetup and GlobalCleanup stages because it measures the data preparation itself:
[Benchmark]
public void GenerateAndAssignData()
{
    _data = DataGenerator.Generate(RowCount, ColumnCount);

    _flexGrid.DataSource = _data.DataTable;

    int firstDataMapColumnIndex = _flexGrid.Cols.Fixed + _data.FirstDataMapColumnIndex;
    int flexGridColumnCount = _flexGrid.Cols.Count;
    int dataTypeCount = _data.DataTypeCount;
    int dataMapIndex = 0;
    for (int columnIndex = firstDataMapColumnIndex; columnIndex < flexGridColumnCount; columnIndex += dataTypeCount)
    {
        _flexGrid.Cols[columnIndex].DataMap = _data.DataMaps[dataMapIndex];
        dataMapIndex++;
    }
}
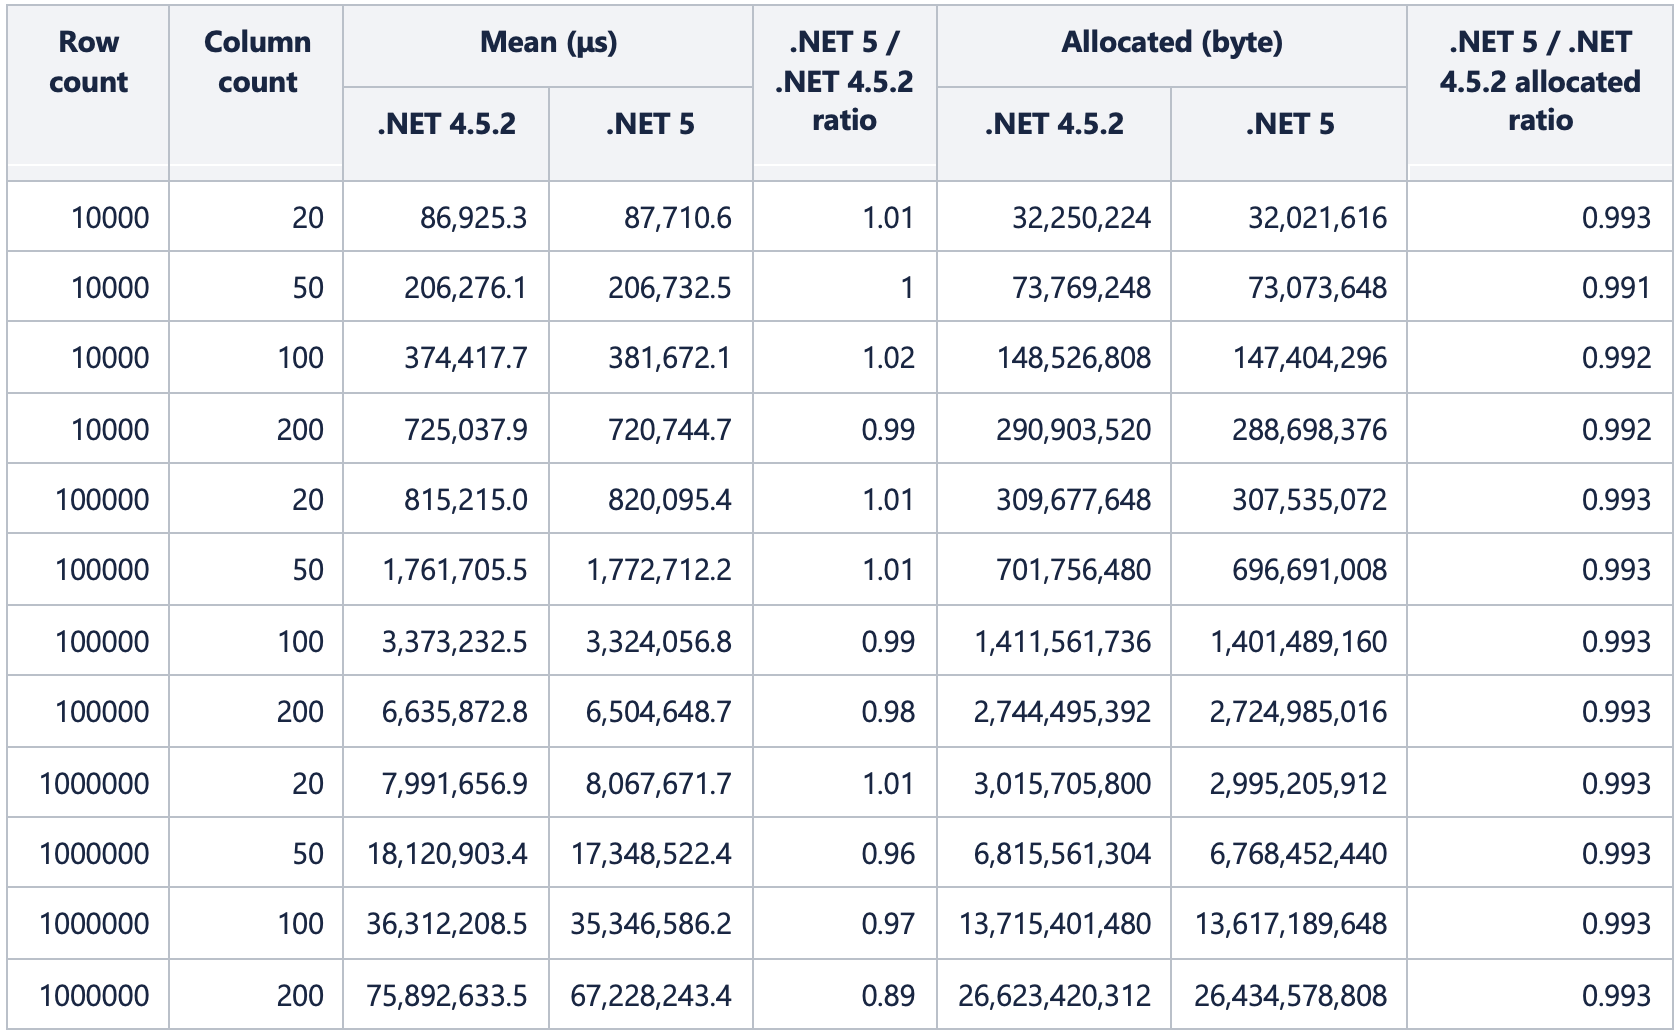
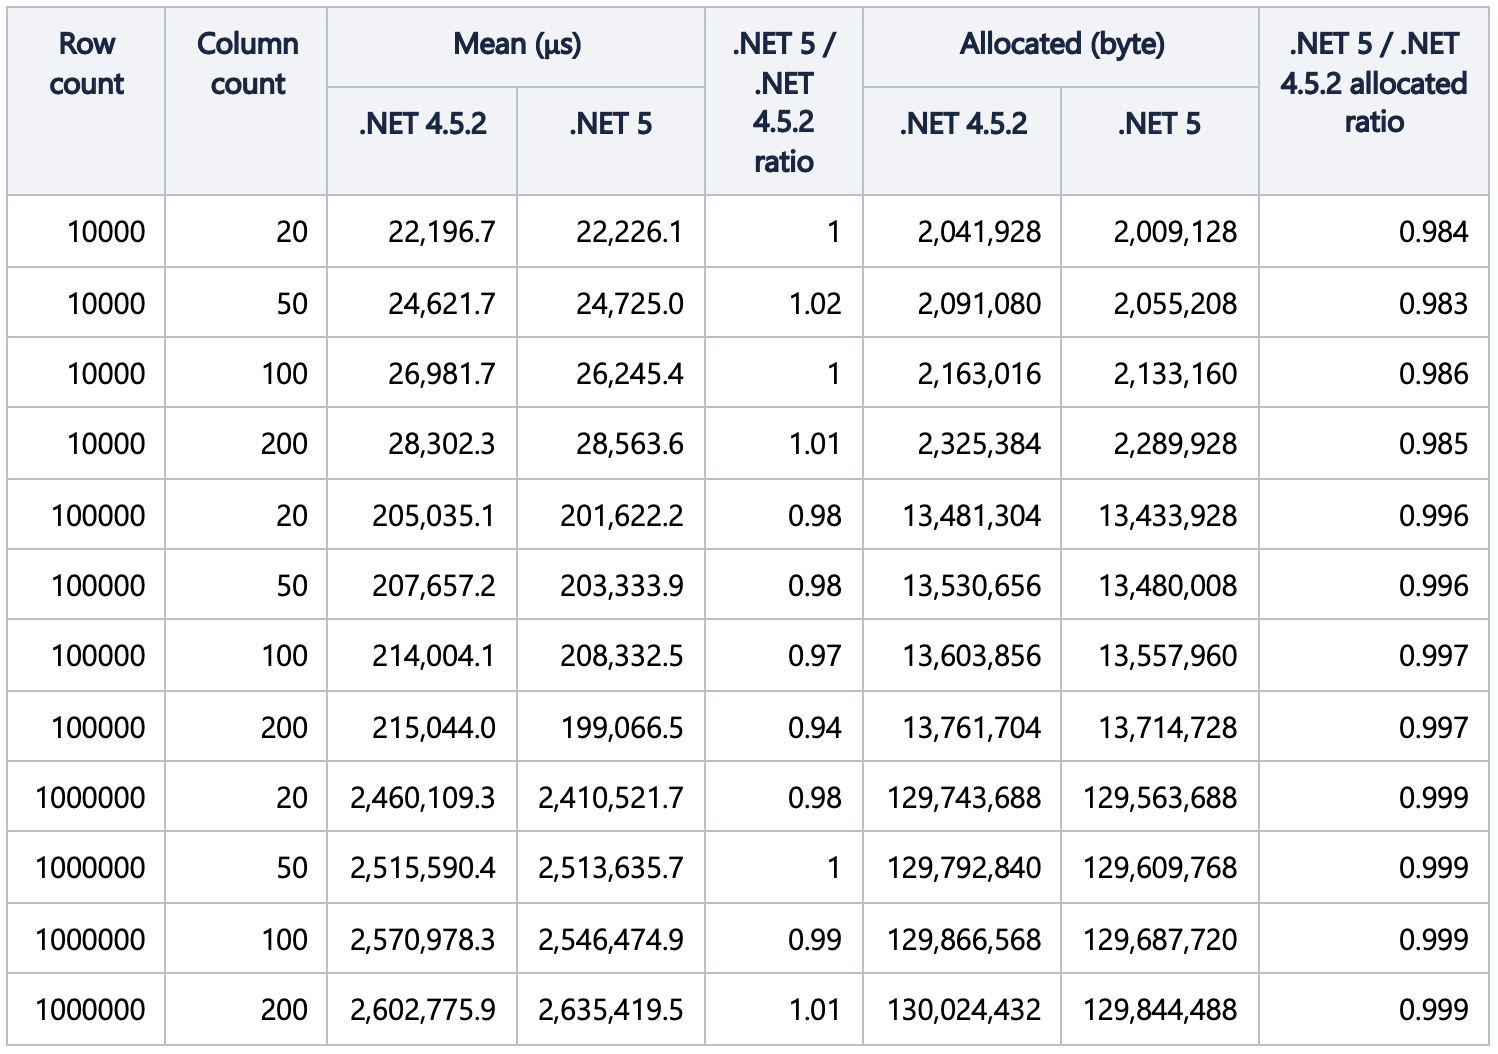
The summary table:
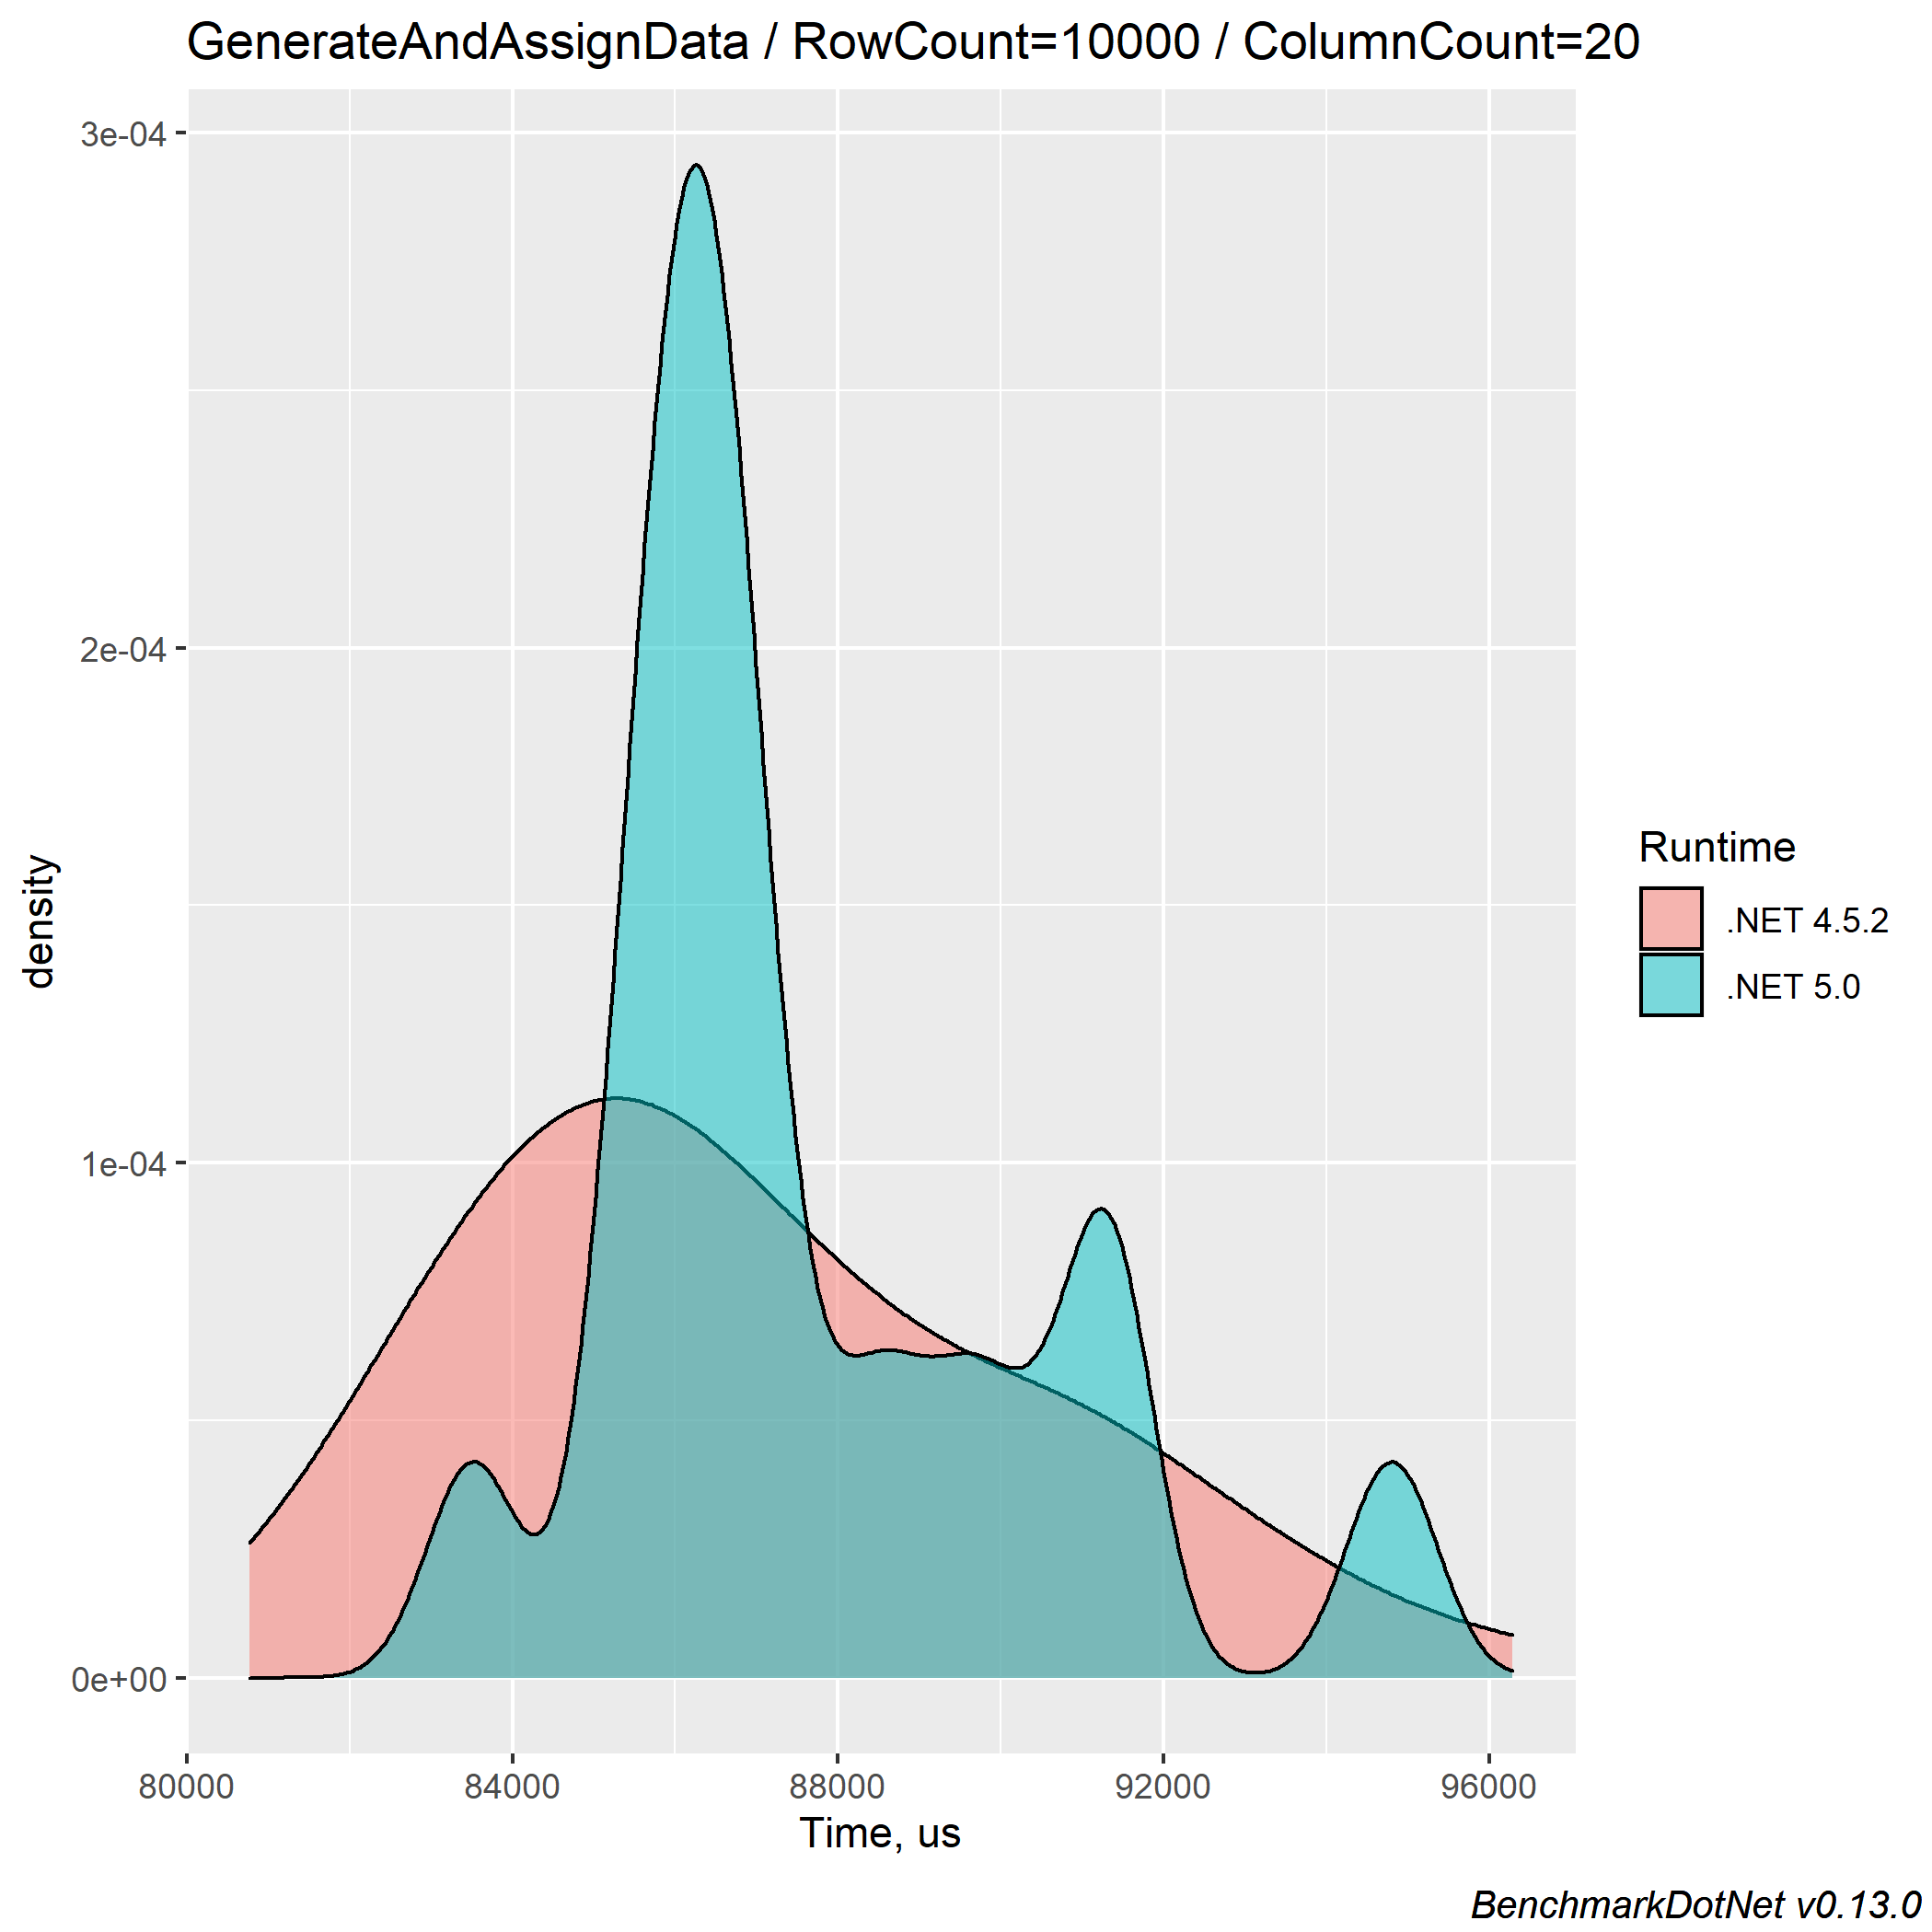
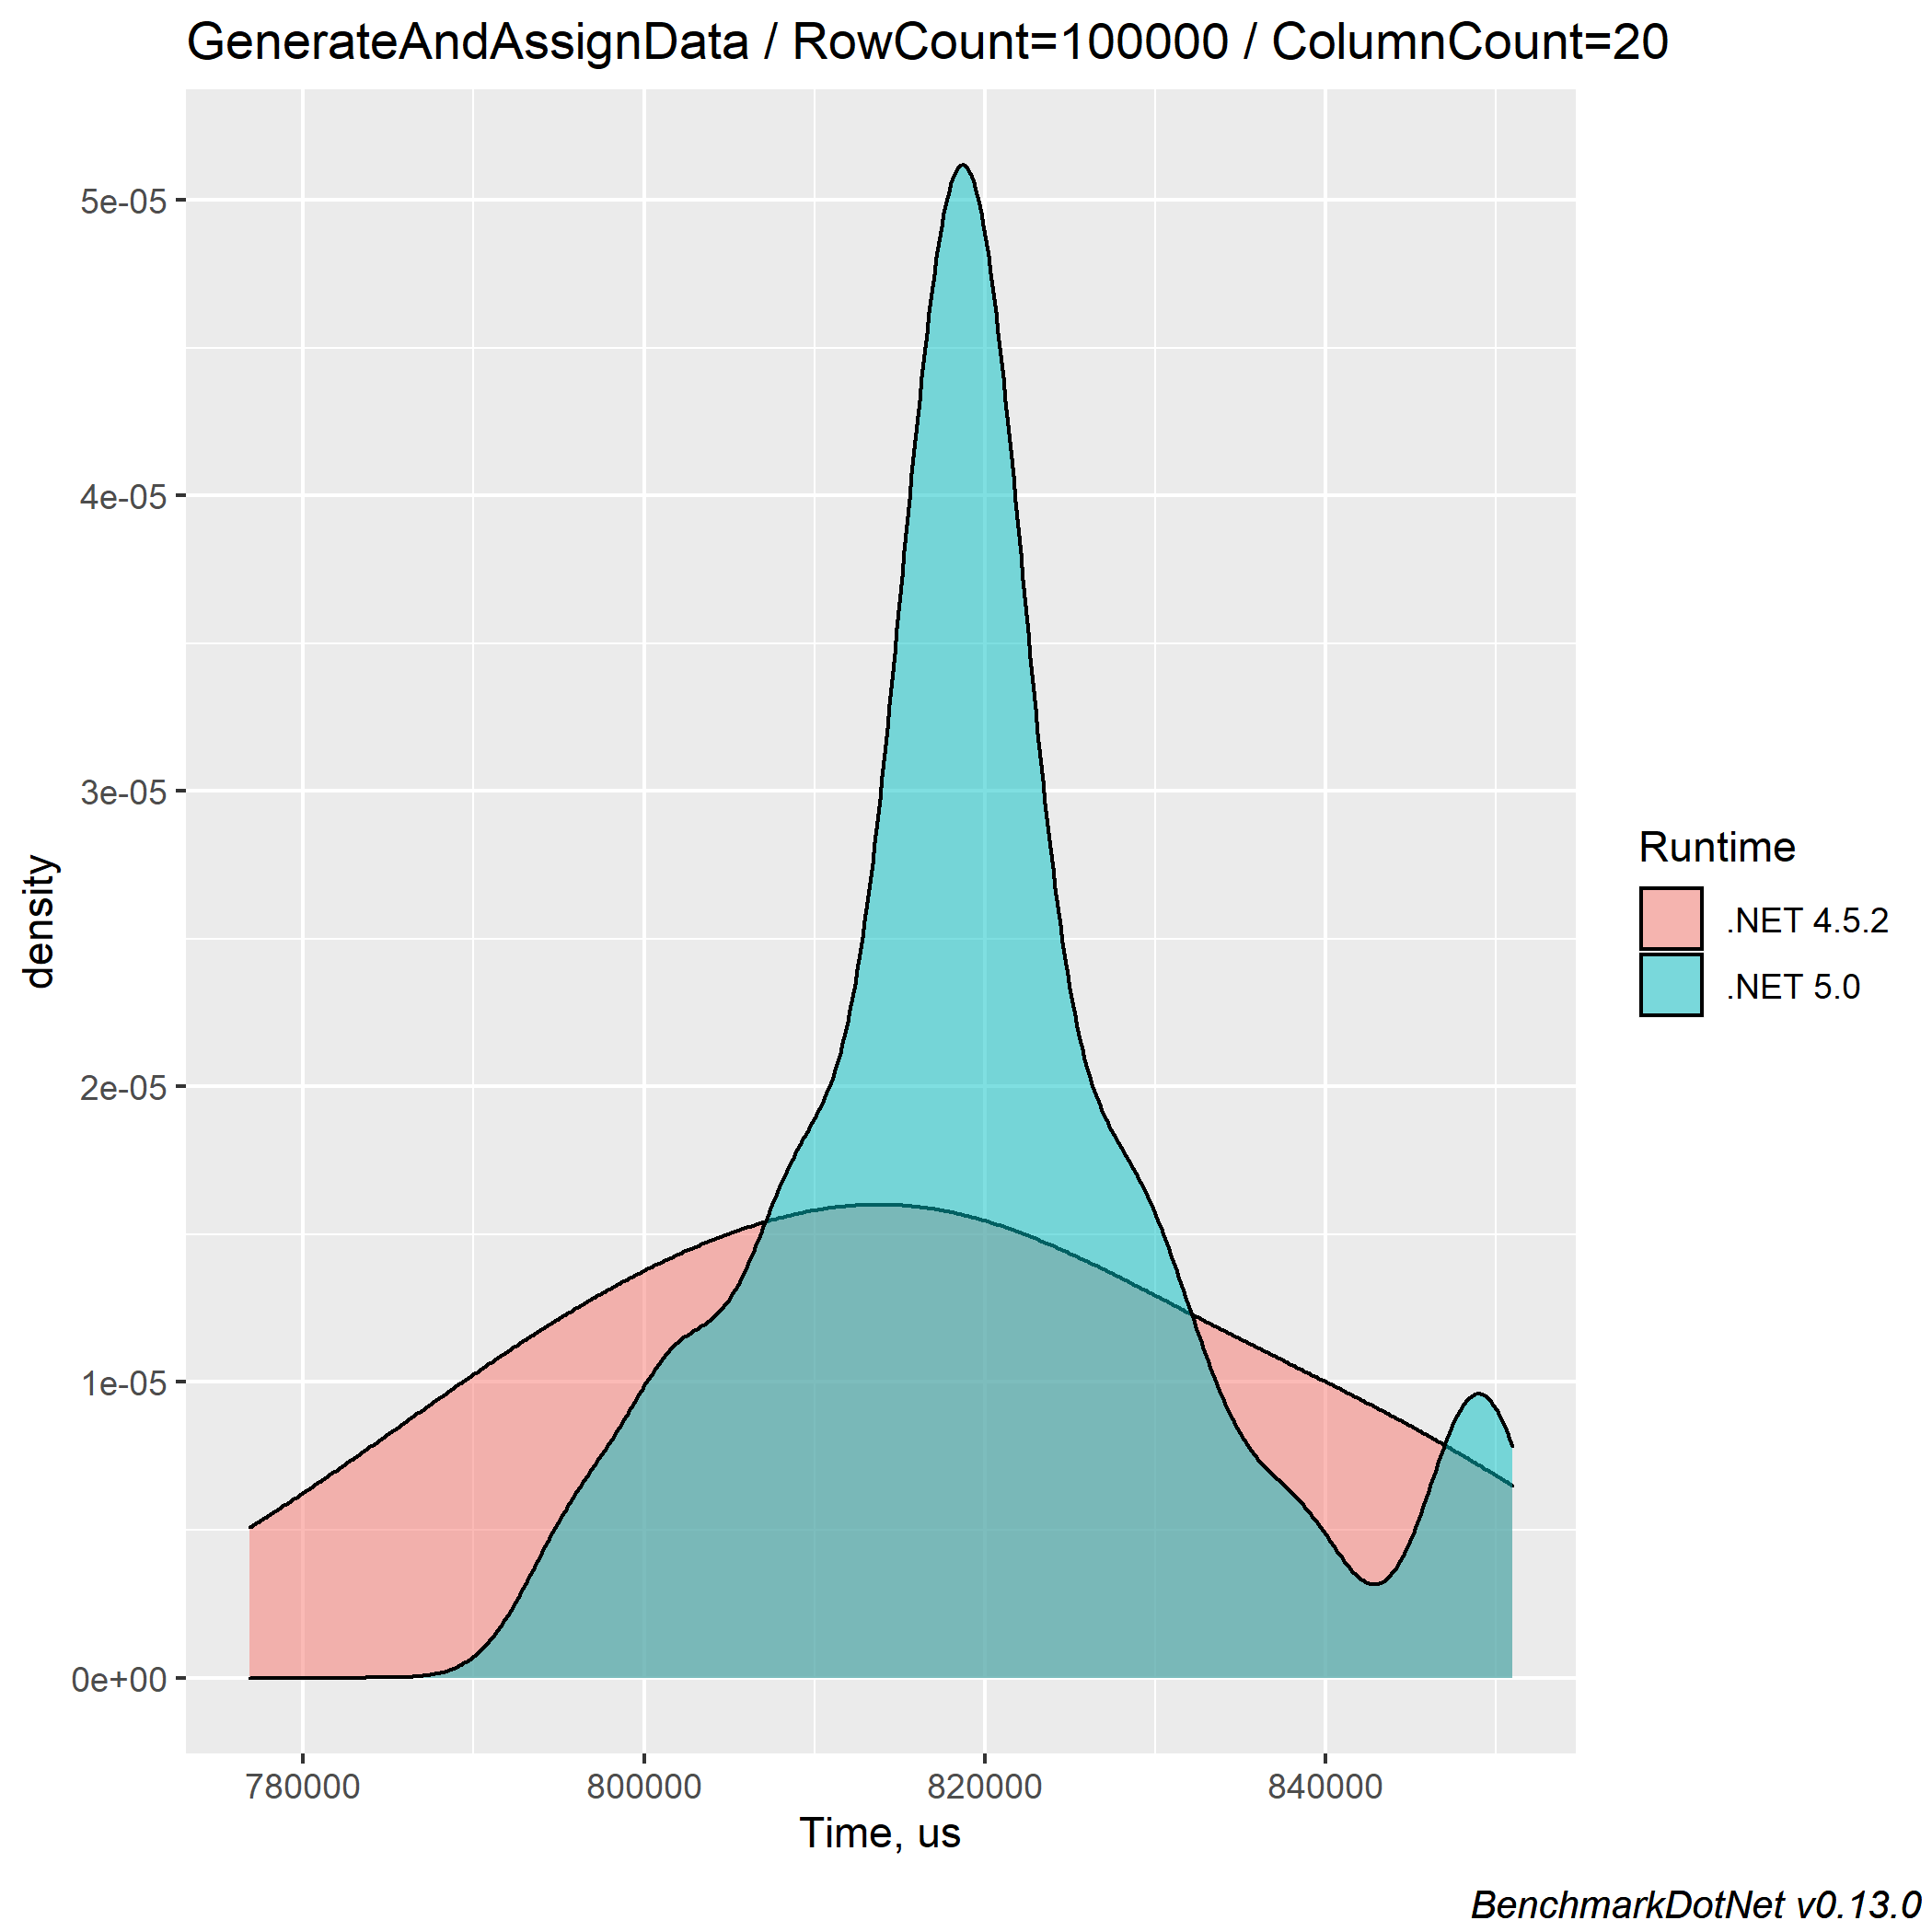
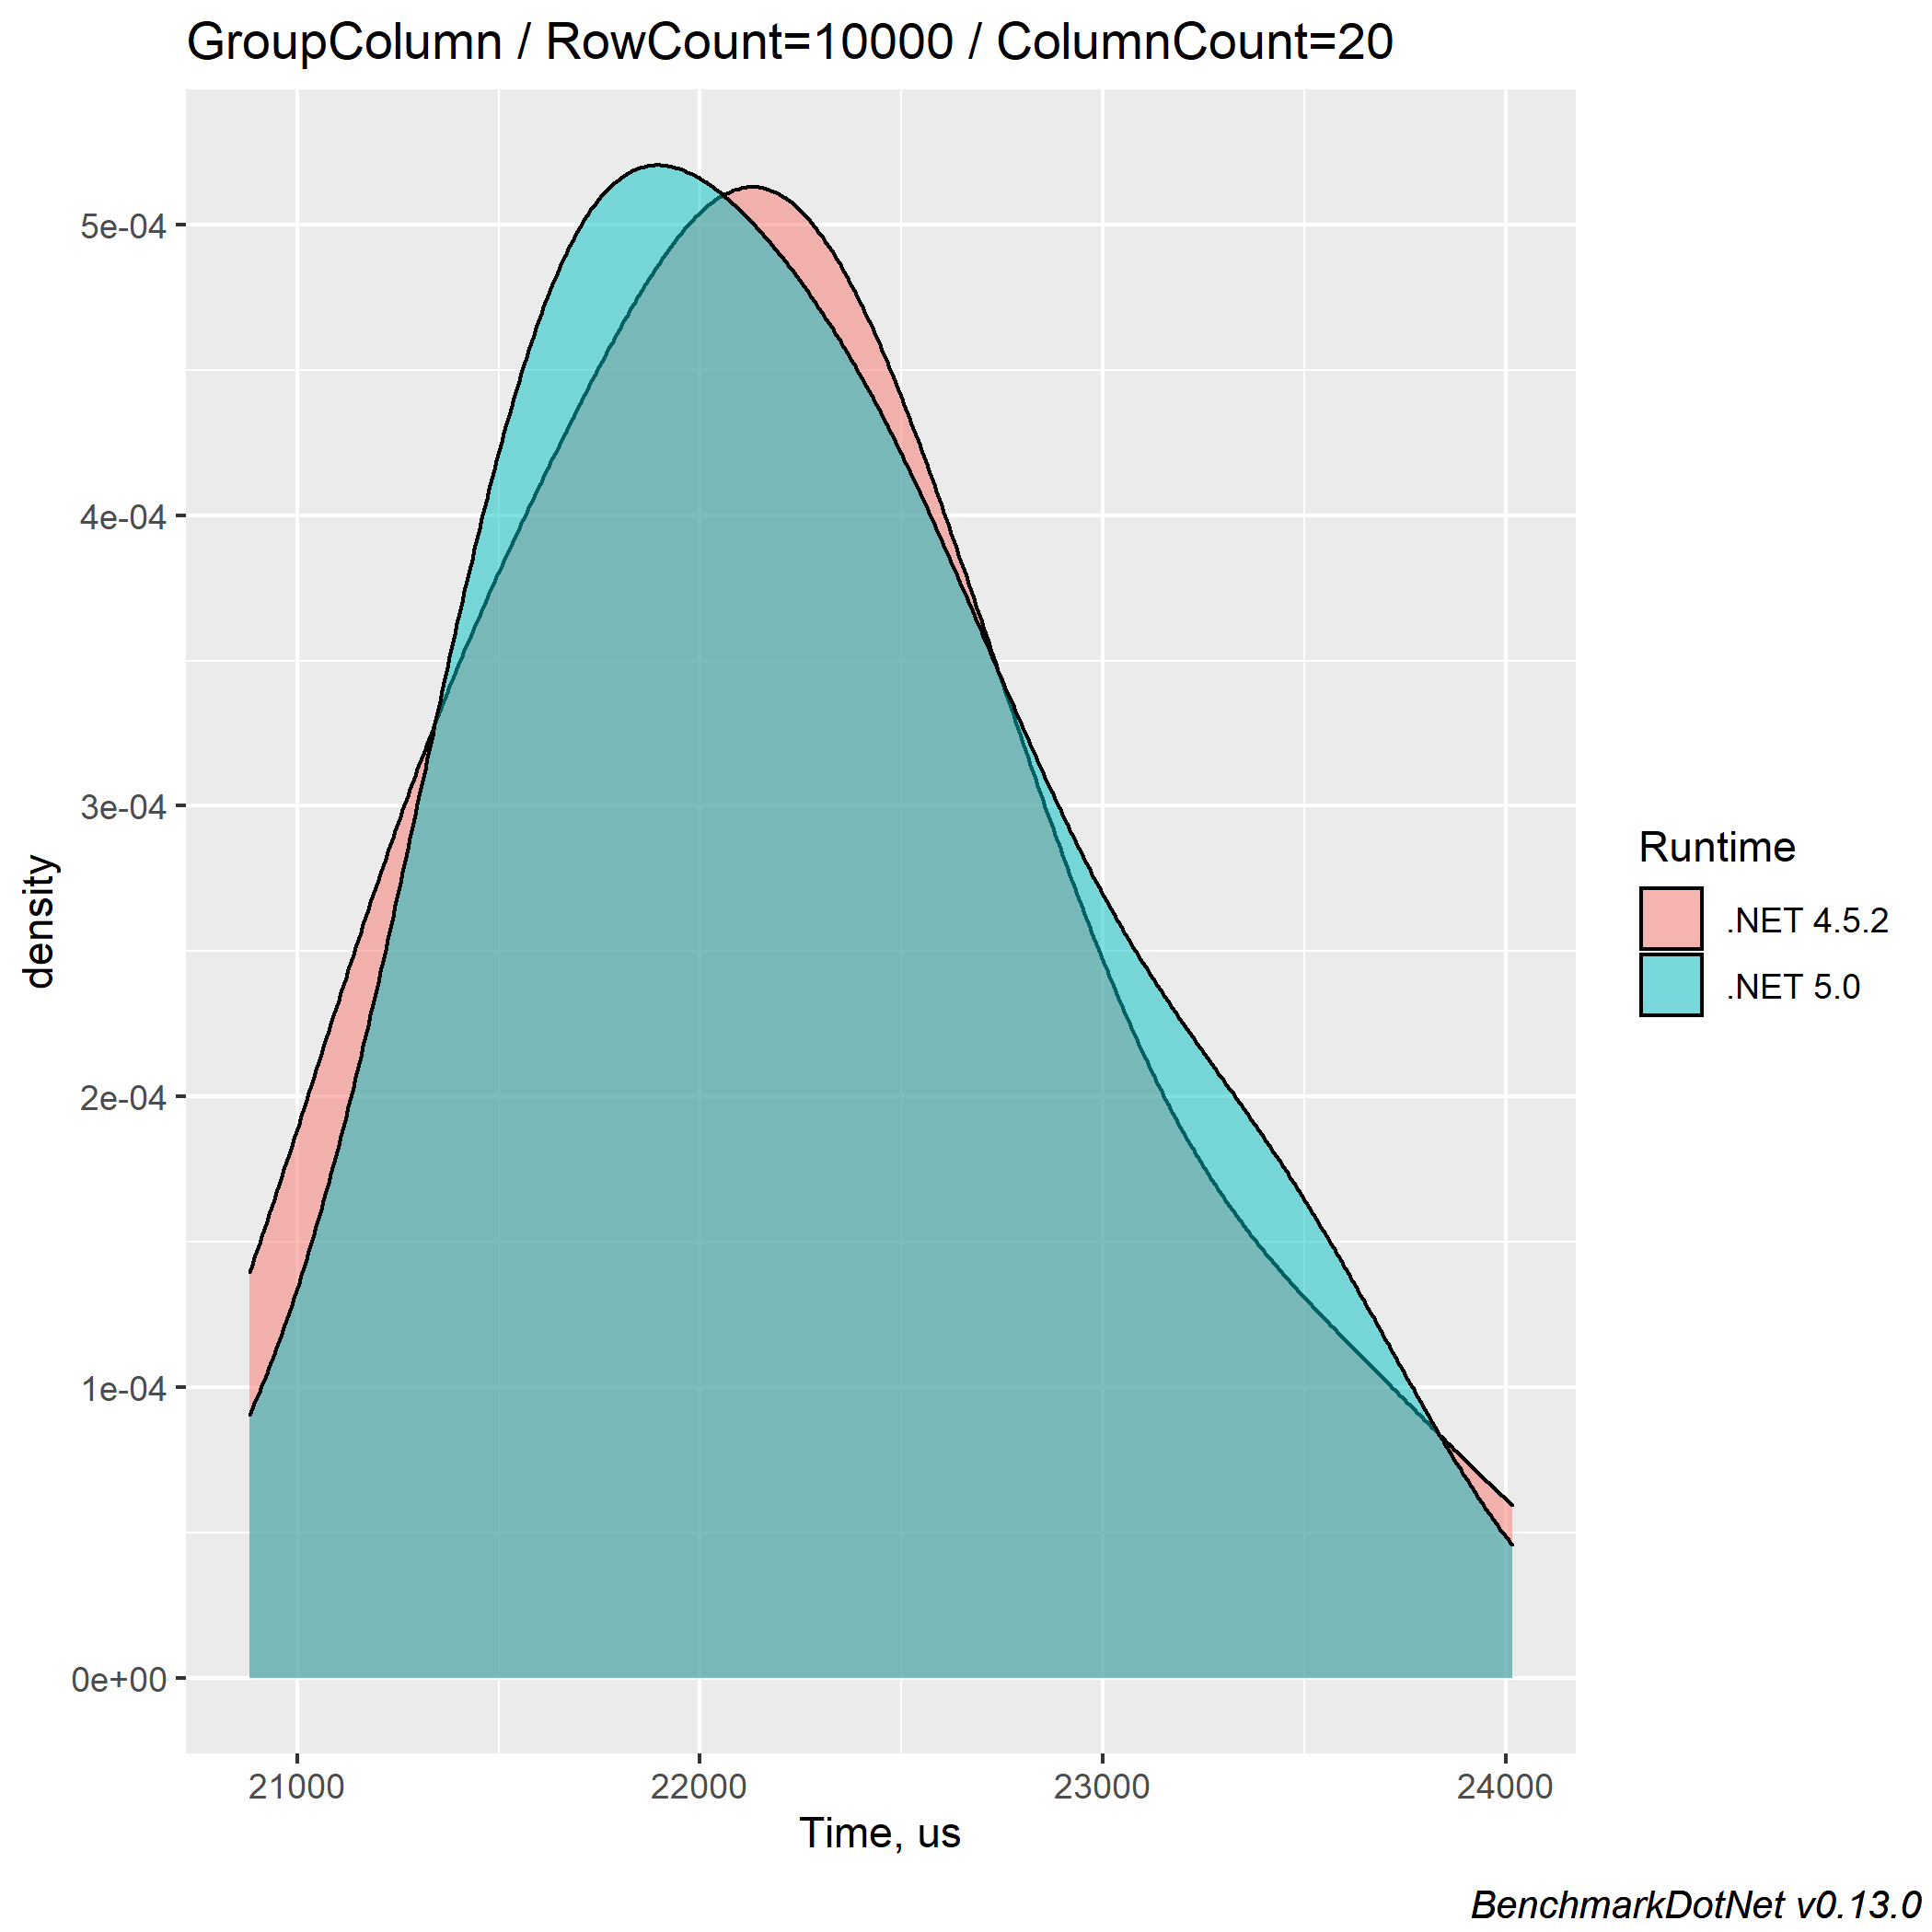
The density plots:
For 10000 rows:
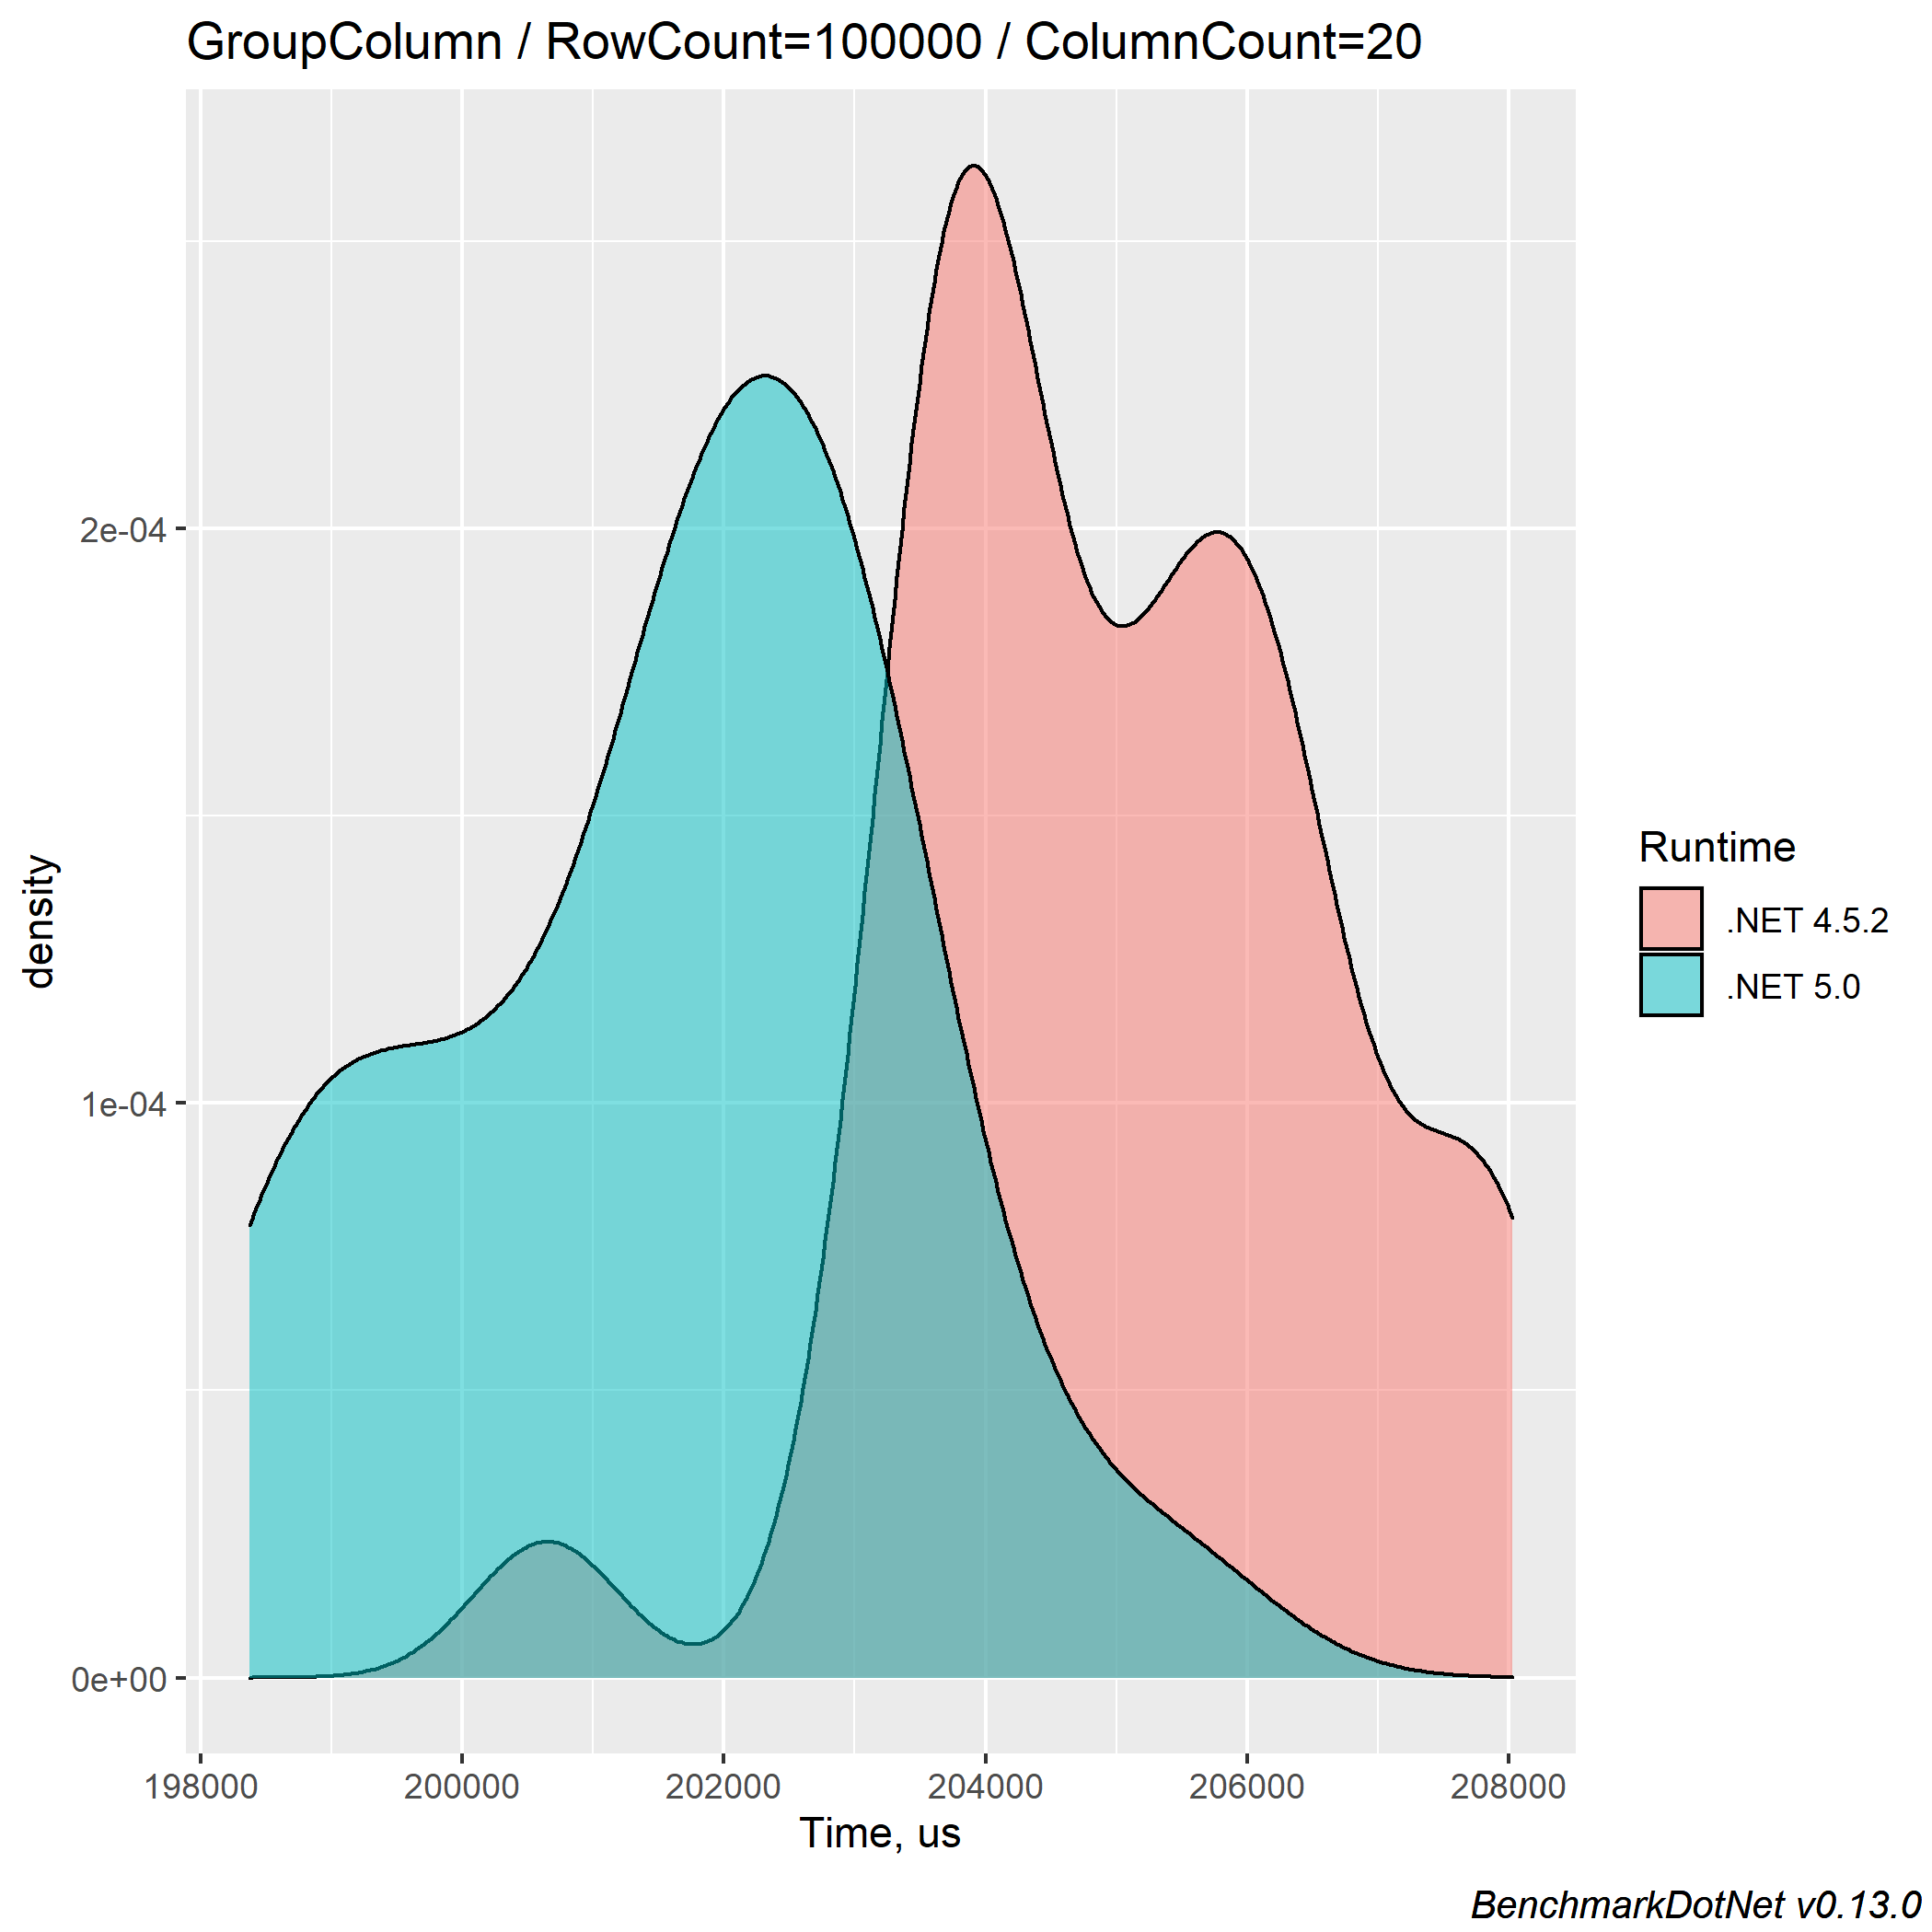
For 100000 rows:
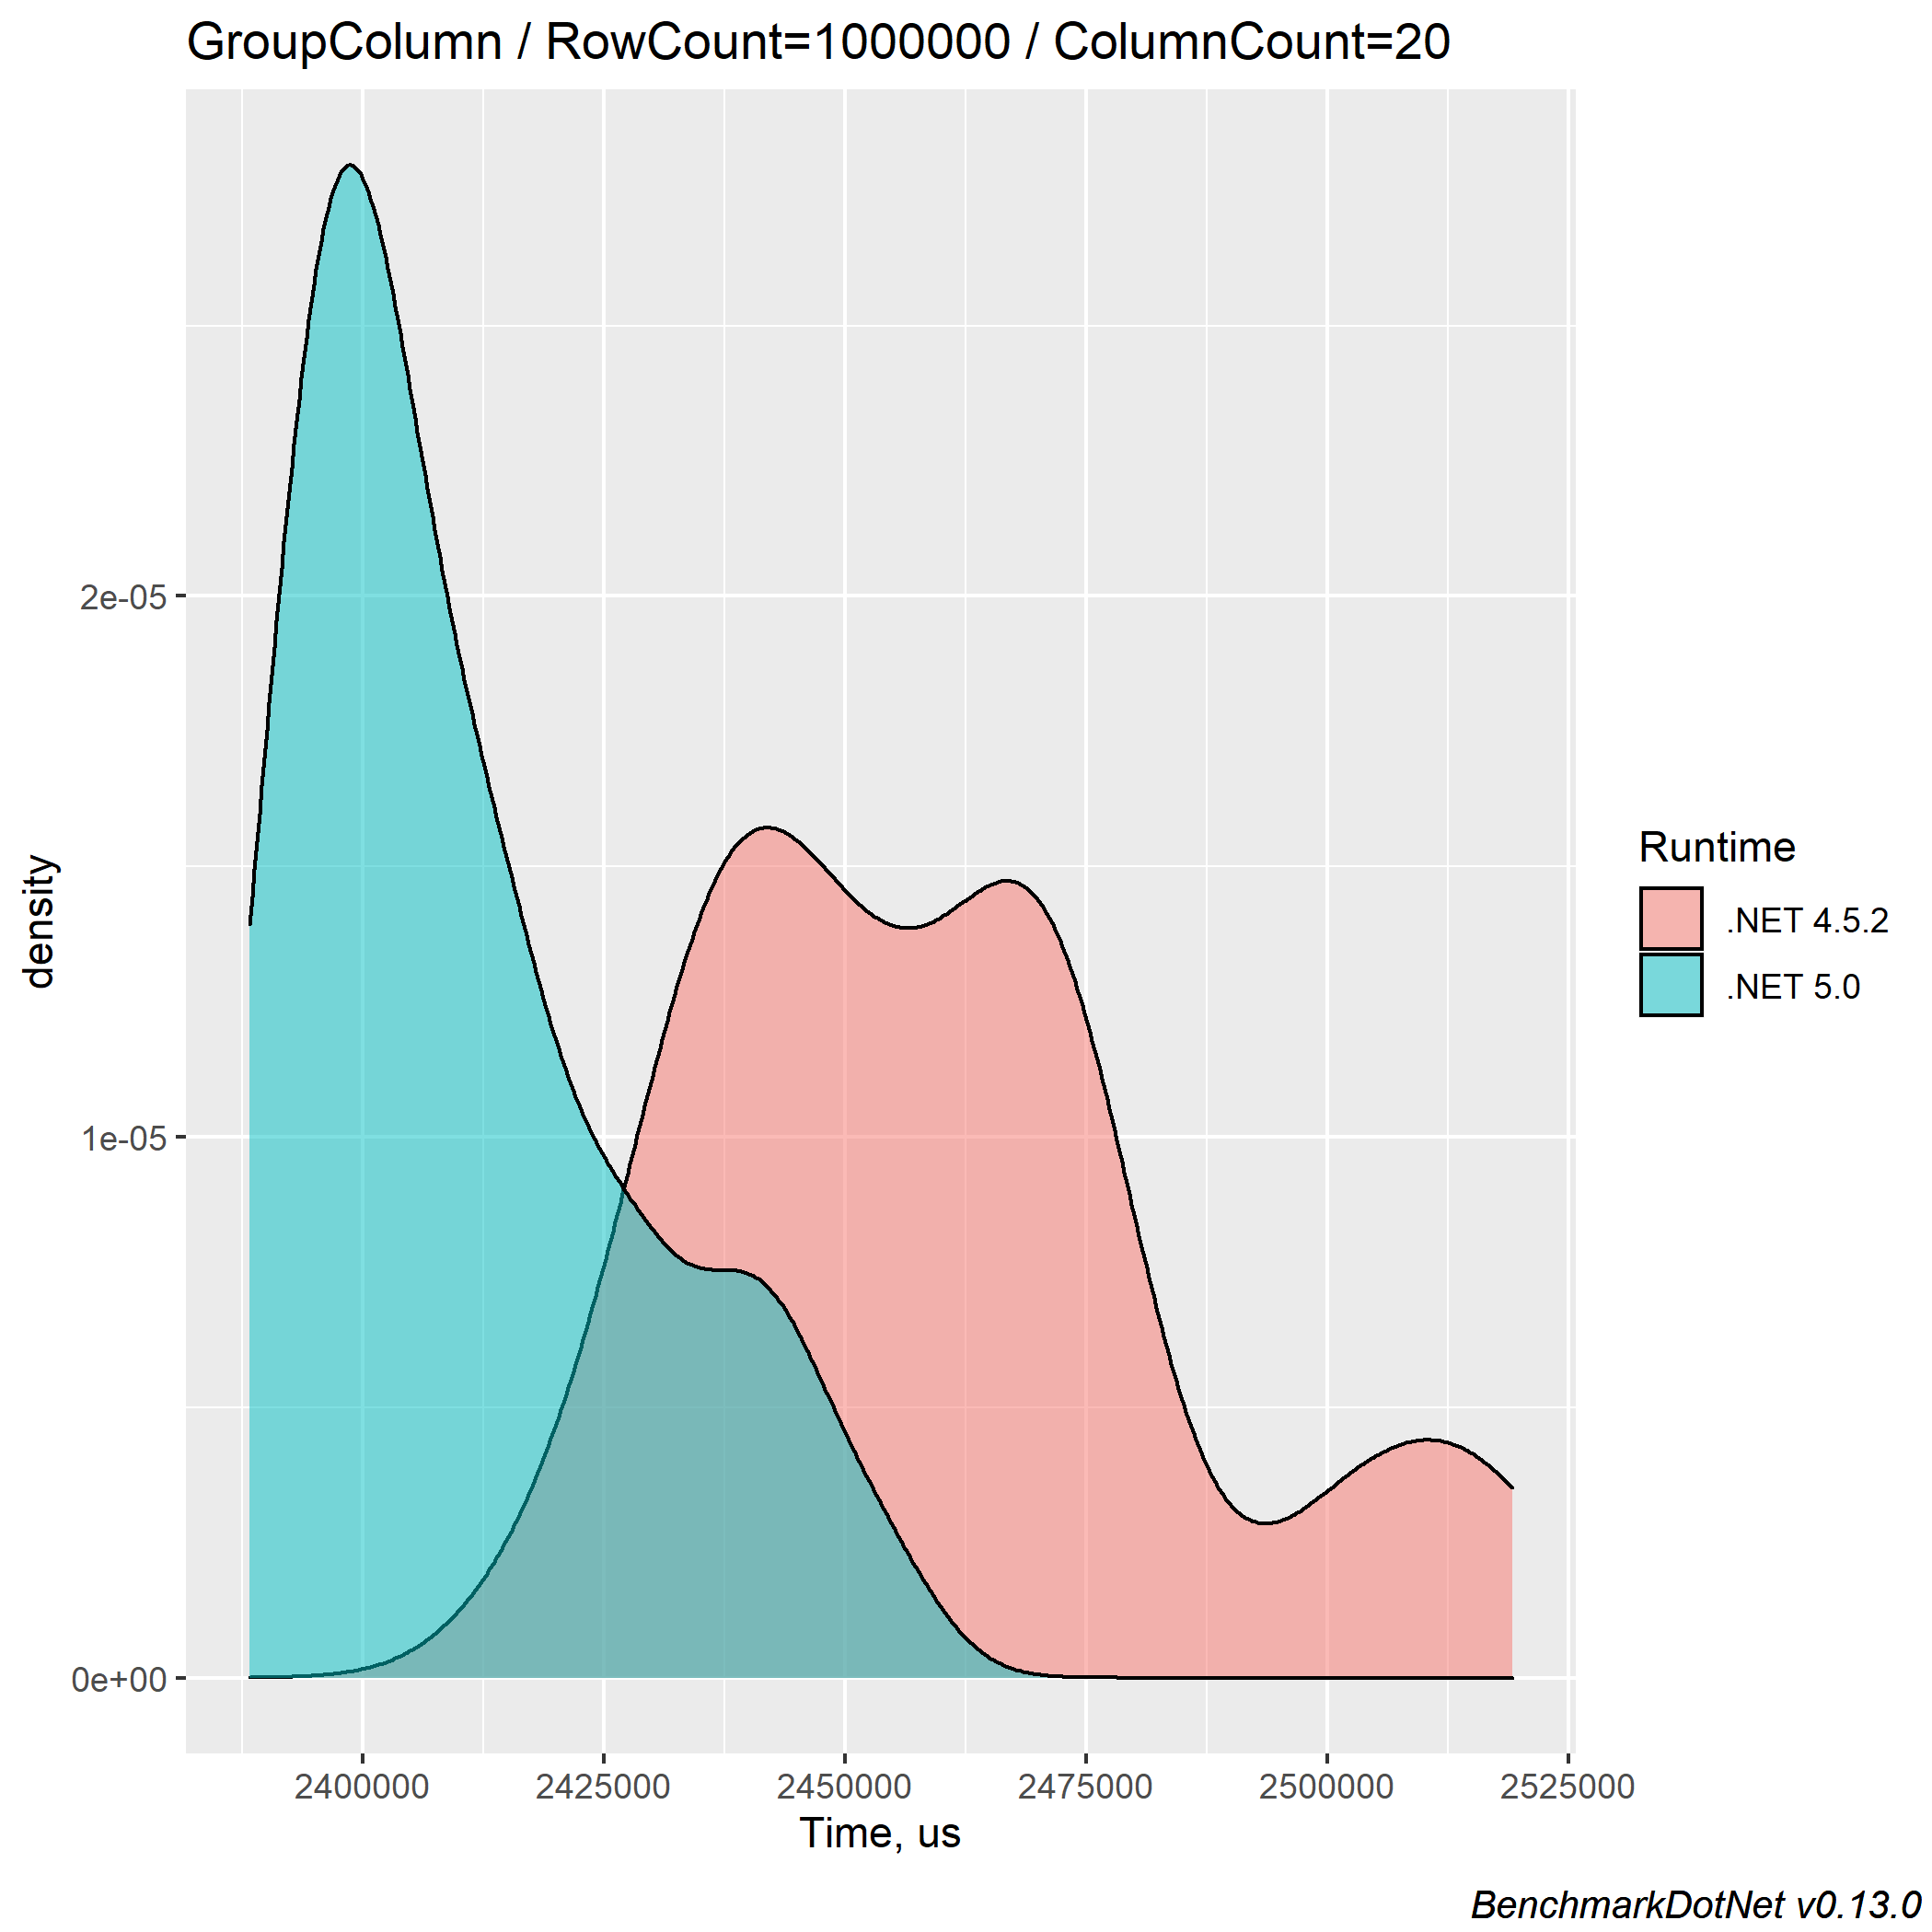
For 1000000 rows:
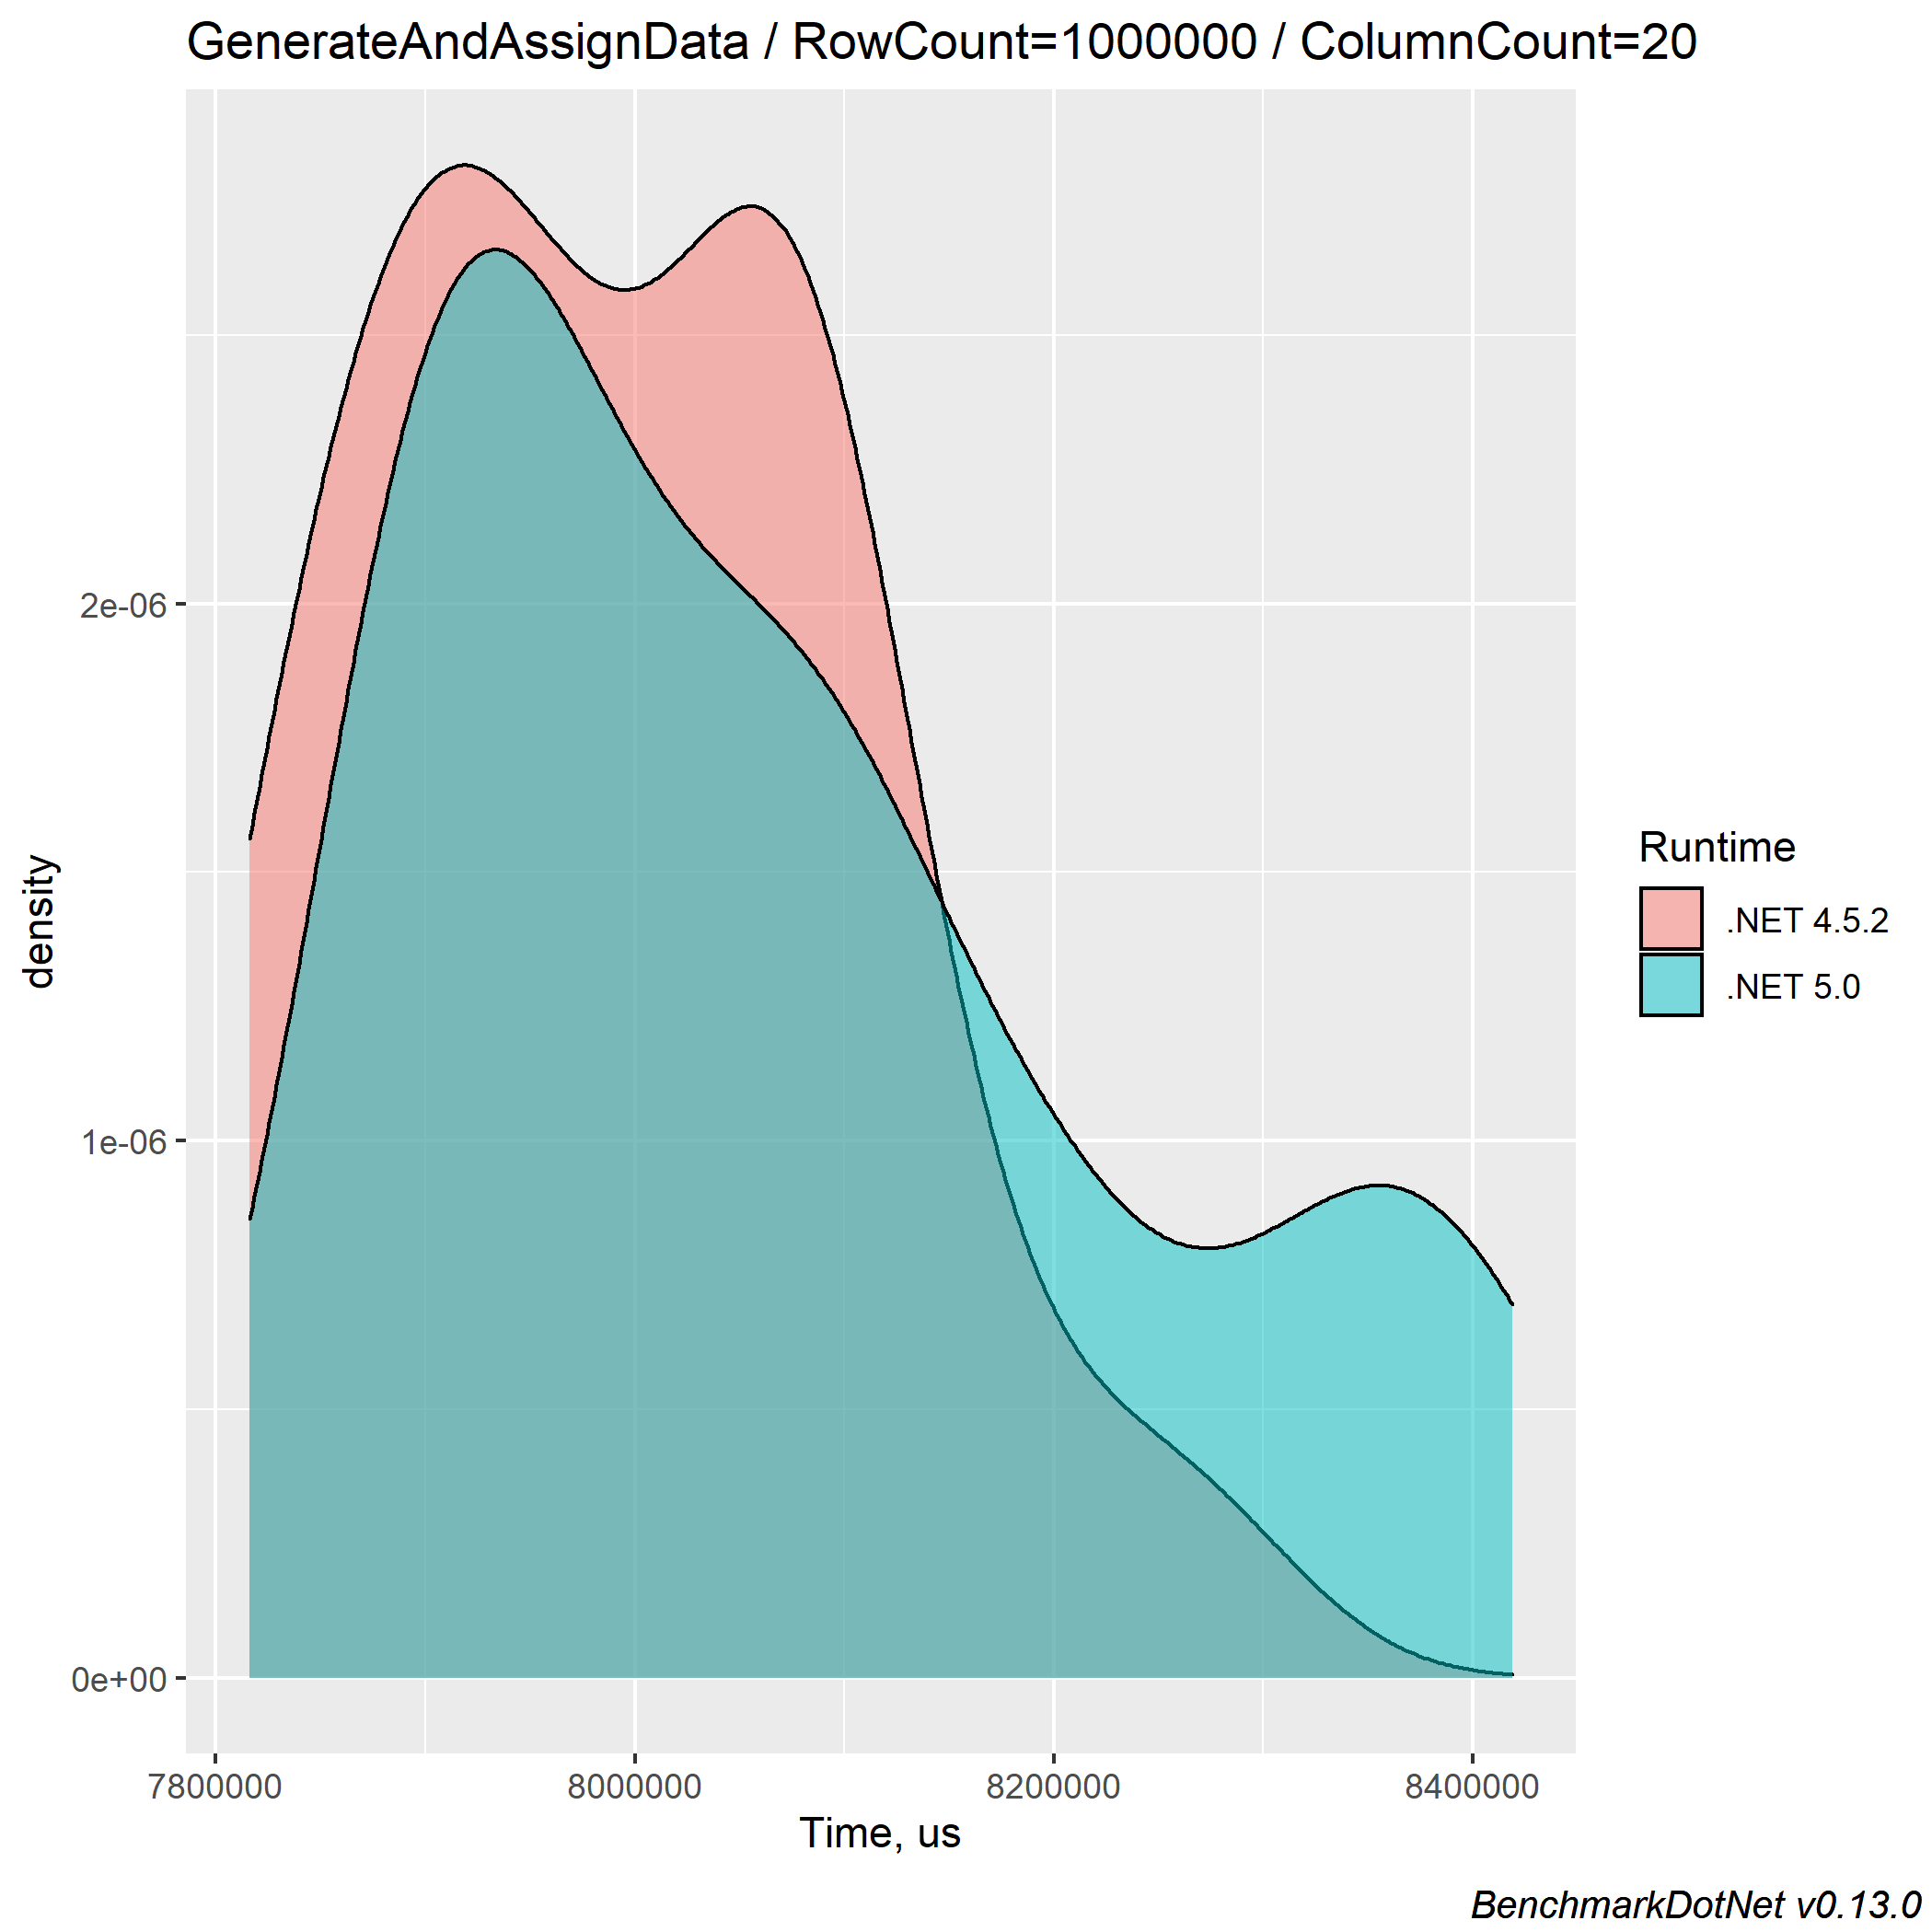
Most of the time, we can see that there is 1-3% difference between .NET Framework 4.5.2 and .NET 5. Sometimes, .NET 5 is faster than .NET 4.5.2, or vice versa. For the heaviest case (1000000 rows and 200 columns) it is up to a 11% performance gain for .NET 5.
Also, for all cases .NET 5 version allocated 0.7%-0.9% less memory. For the heaviest case, it is about 188 Megabytes.
Assigning Data
In the real world, not many developers would generate data for the end application. The data already exists in some databases, and the developer only needs to assign it to FlexGrid as a data source.
The next part of our test method measures only assigning of already prepared data:
[Benchmark]
public void AssignData()
{
    _flexGrid.DataSource = _data.DataTable;

    int firstDataMapColumnIndex = _flexGrid.Cols.Fixed + _data.FirstDataMapColumnIndex;
    int flexGridColumnCount = _flexGrid.Cols.Count;
    int dataTypeCount = _data.DataTypeCount;
    int dataMapIndex = 0;
    for (int columnIndex = firstDataMapColumnIndex; columnIndex < flexGridColumnCount; columnIndex += dataTypeCount)
    {
        _flexGrid.Cols[columnIndex].DataMap = _data.DataMaps[dataMapIndex];
        dataMapIndex++;
    }
}
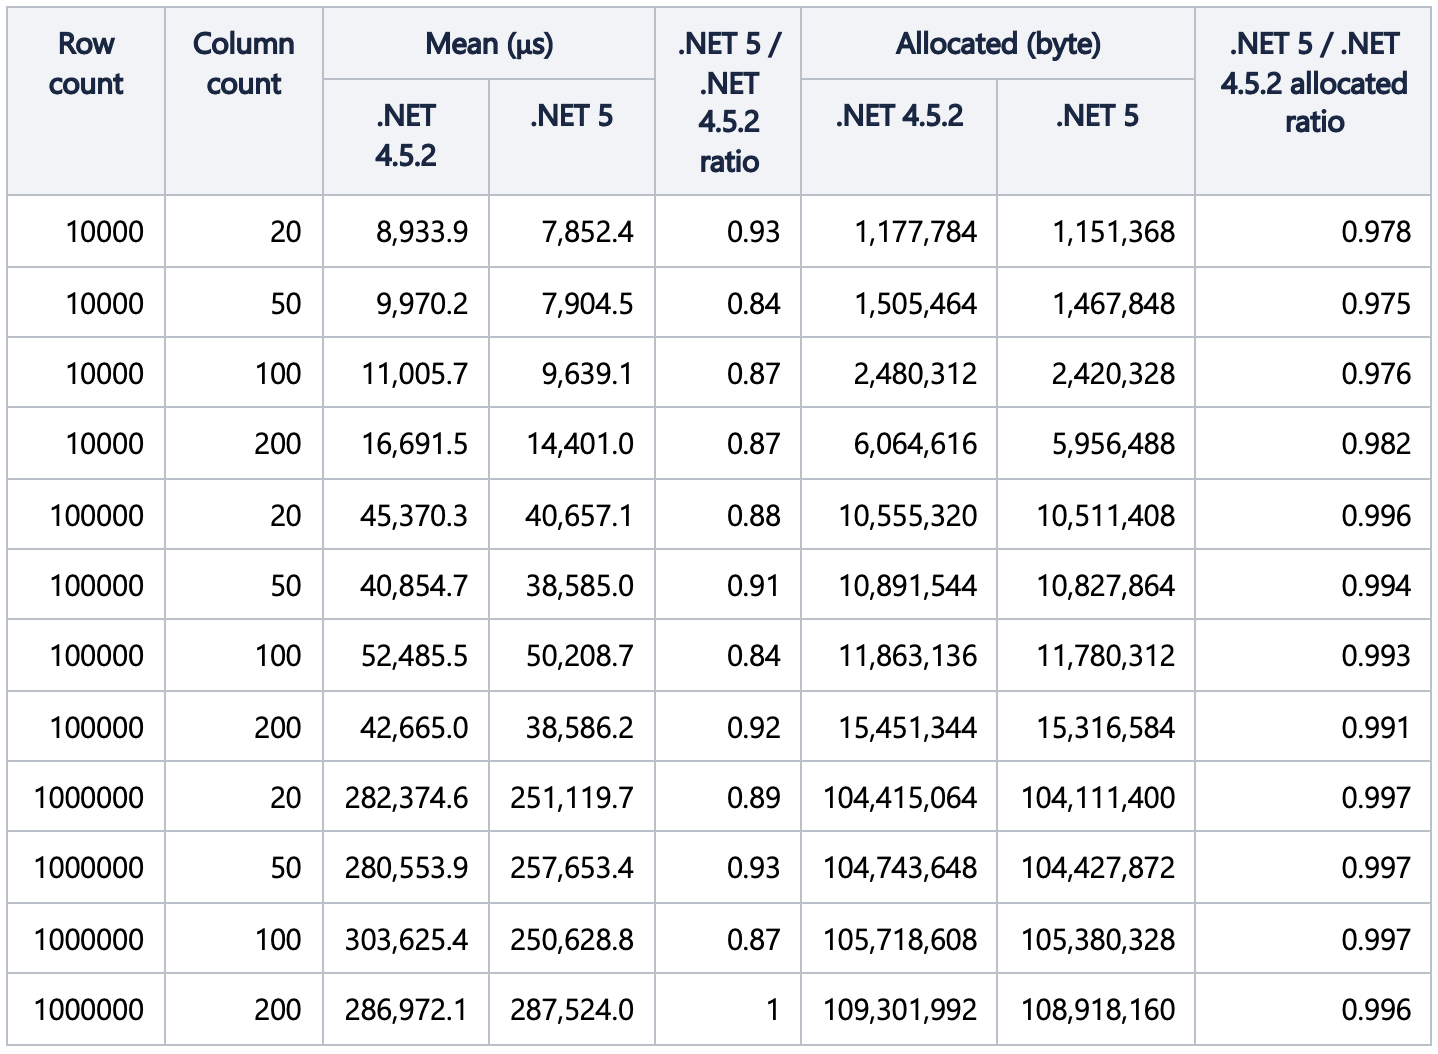
The summary table:
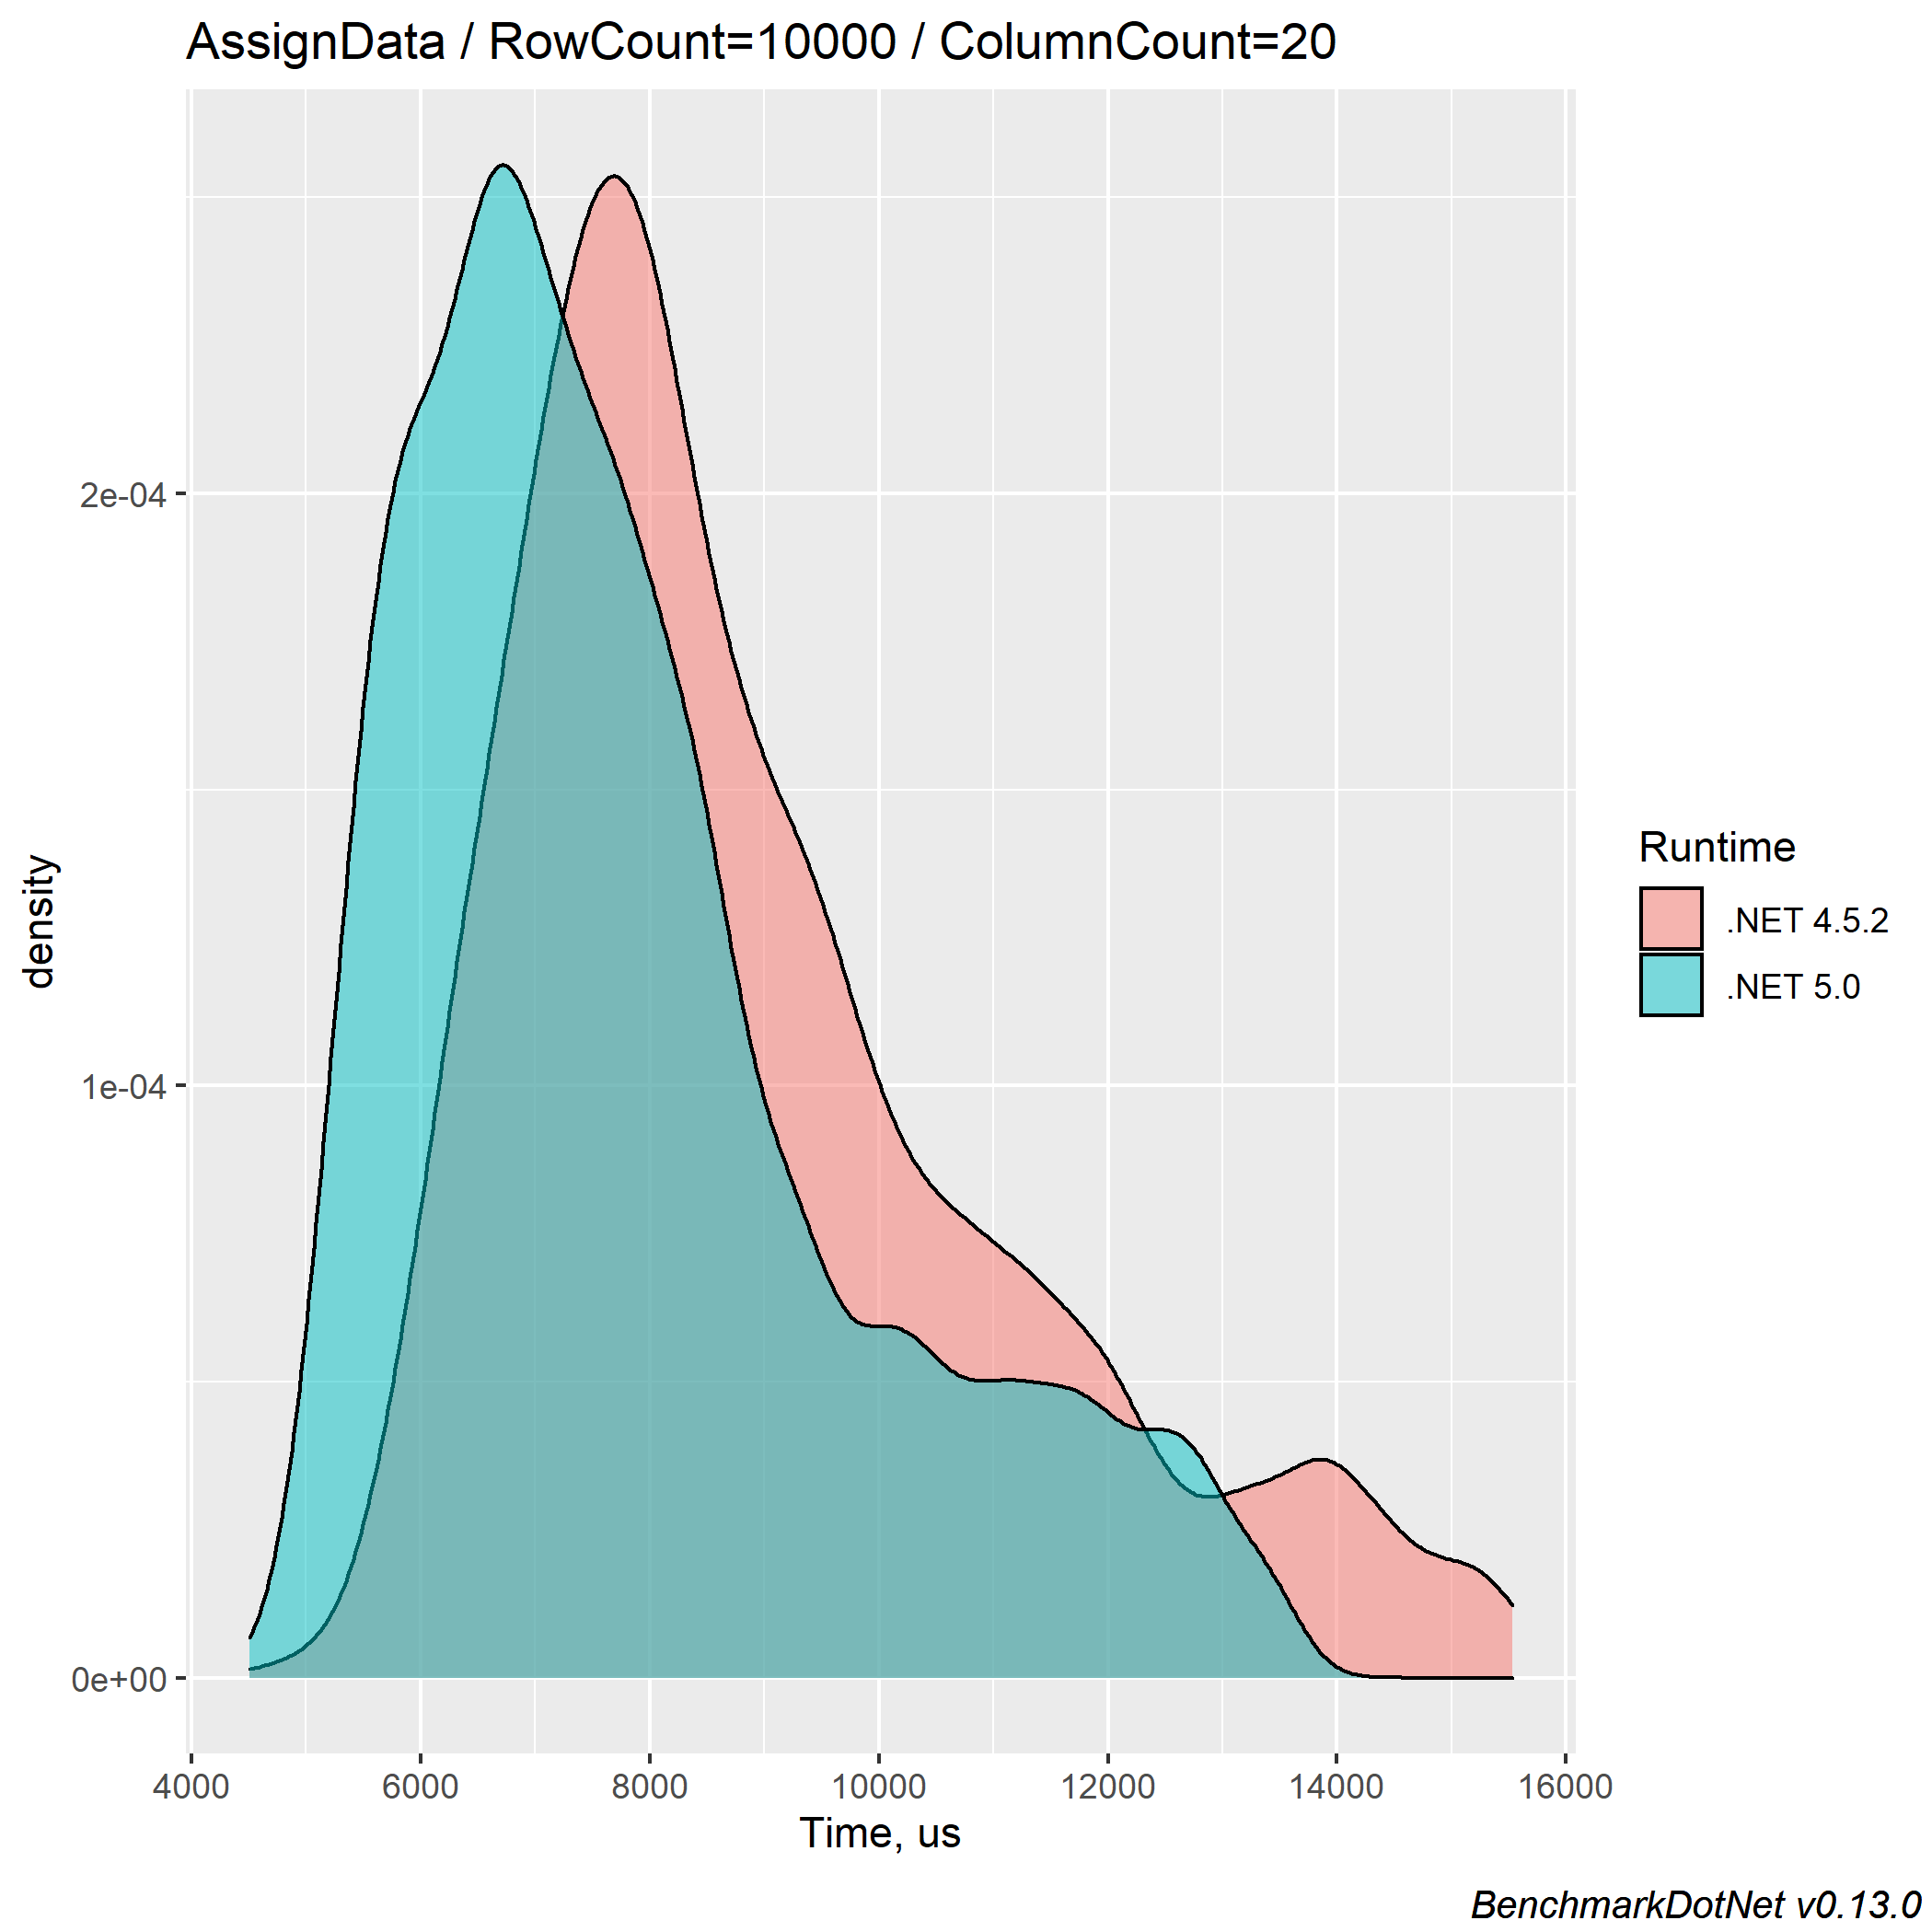
The density plots:
For 10000 rows:
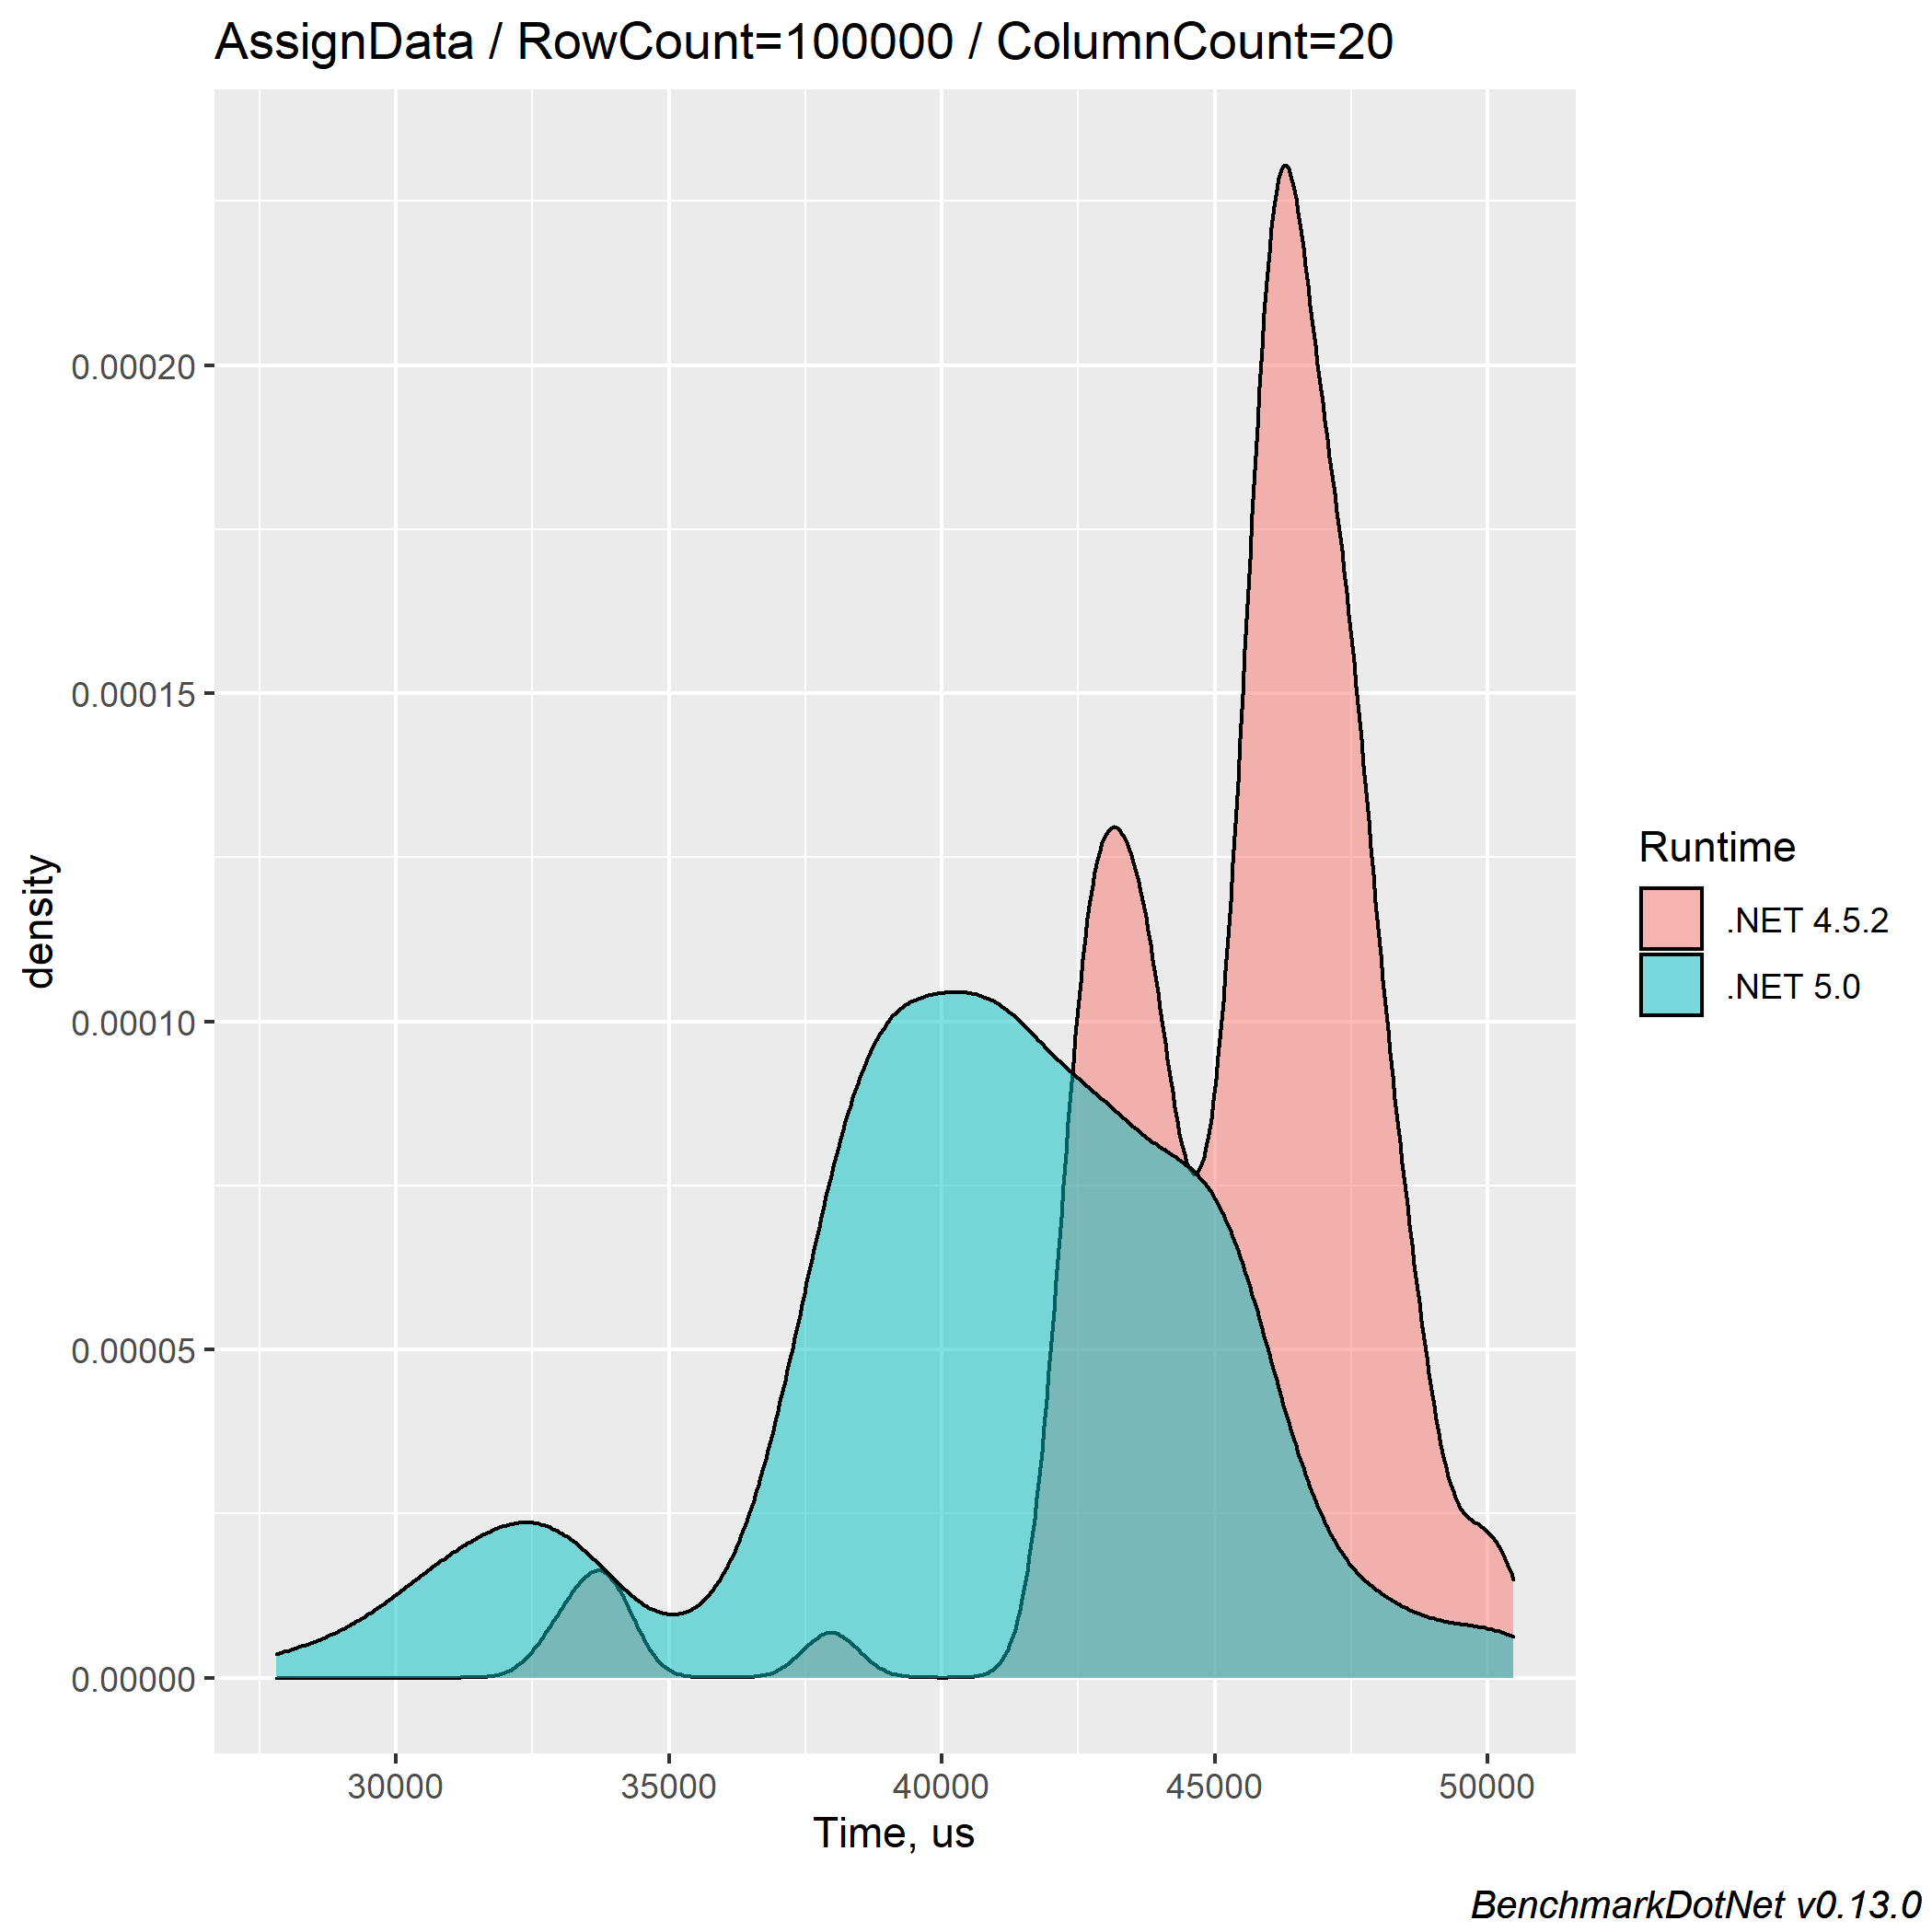
For 100000 rows:
For 1000000 rows:
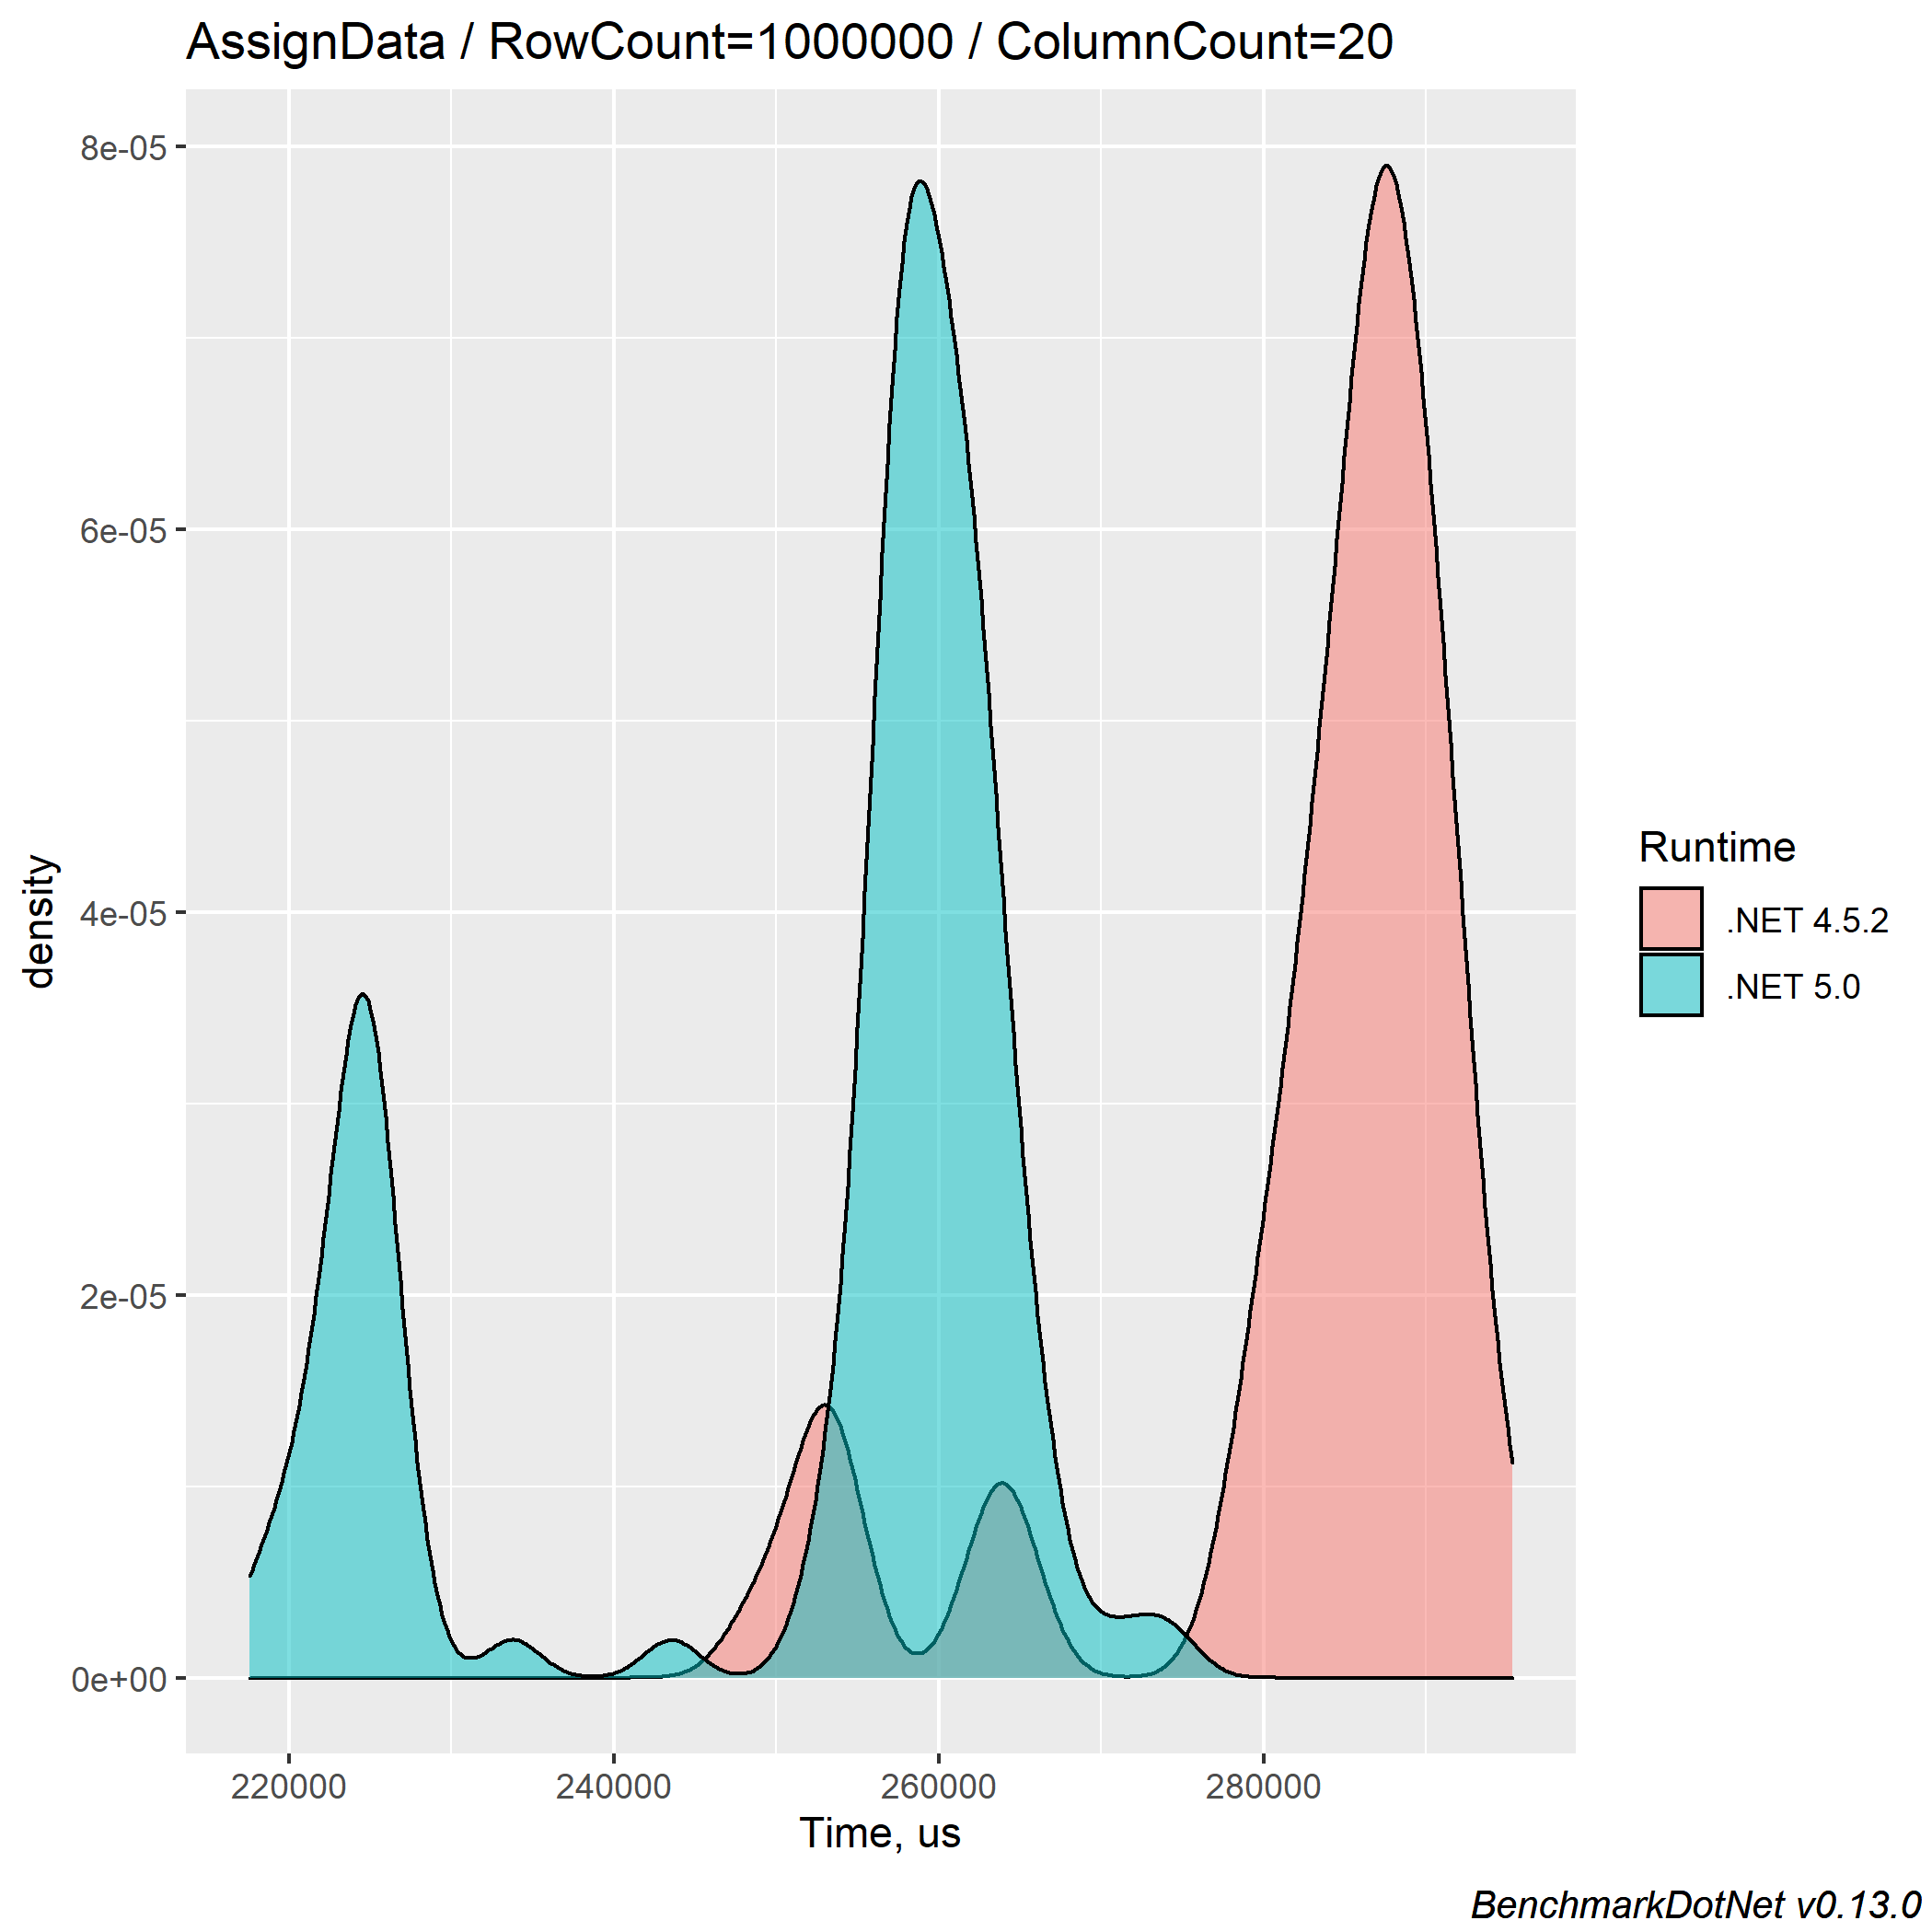
For the current test, we can see that the performance of the .NET 5 version has increased to 16% for several cases, and there isn't any case where the .NET 5 version is slower than .NET Framework 4.5.2.
There is also is up to a 2.5% memory improvement for .NET 5.
Painting the Grid
No UI control can show data without the painting (also known as drawing or rendering) operation. Our next benchmark measures how long it takes to paint the whole grid.
We previously mentioned the Refresh method. According to the documentation, this method forces the control to invalidate its client area and immediately redraw itself. Internally, such a method is not used often, and the Invalidate method is preferred.
But unlike Invalidate, the Refresh method forces the synchronous paint and allows us to measure the time needed to paint the whole grid:
[Benchmark]
public void PaintGrid()
{
    _flexGrid.Refresh();
}
The summary table:
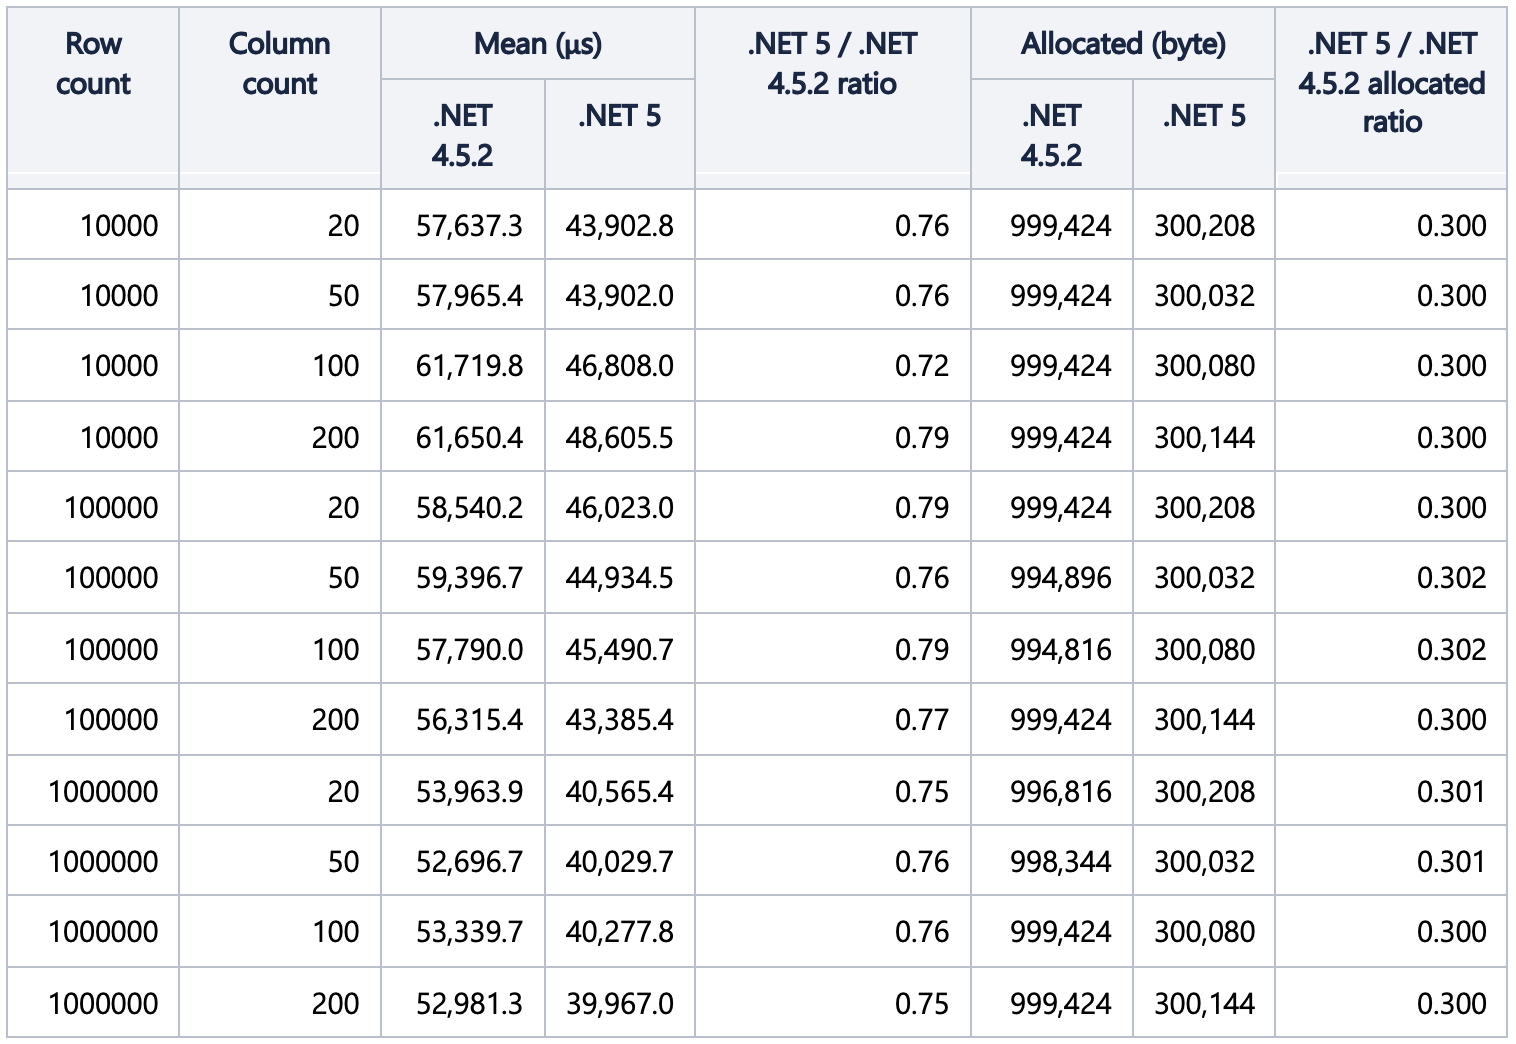
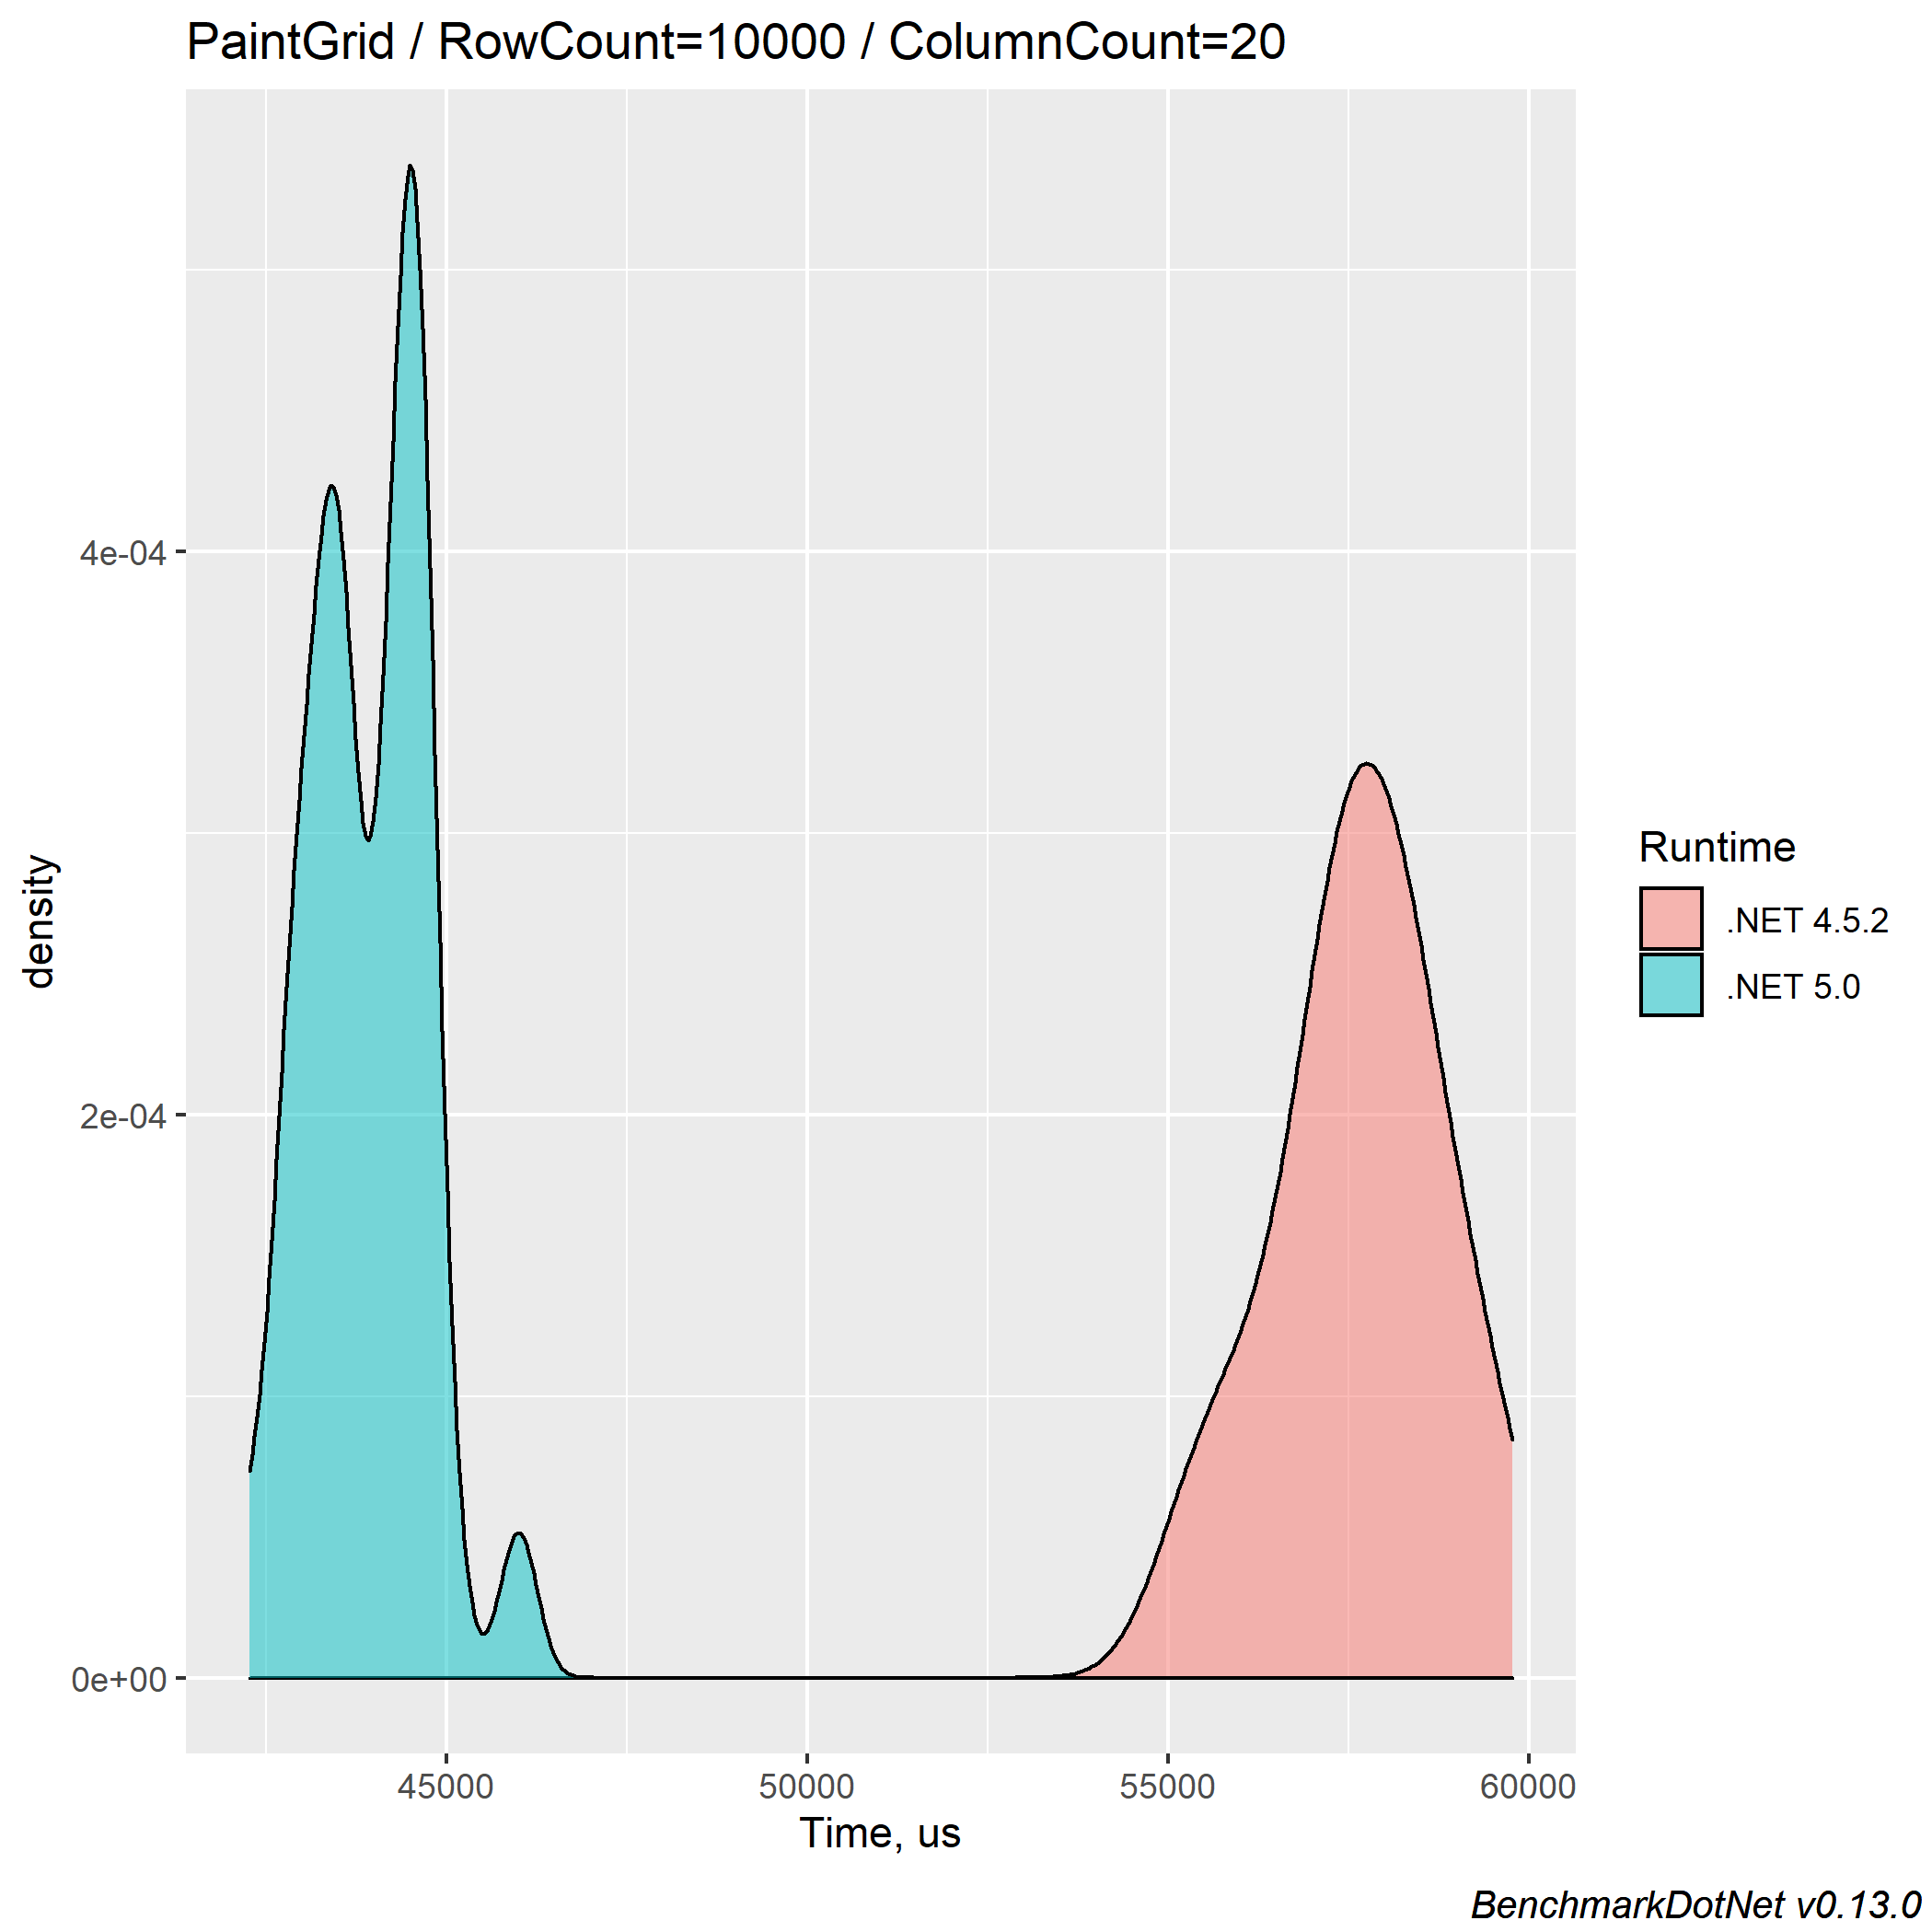
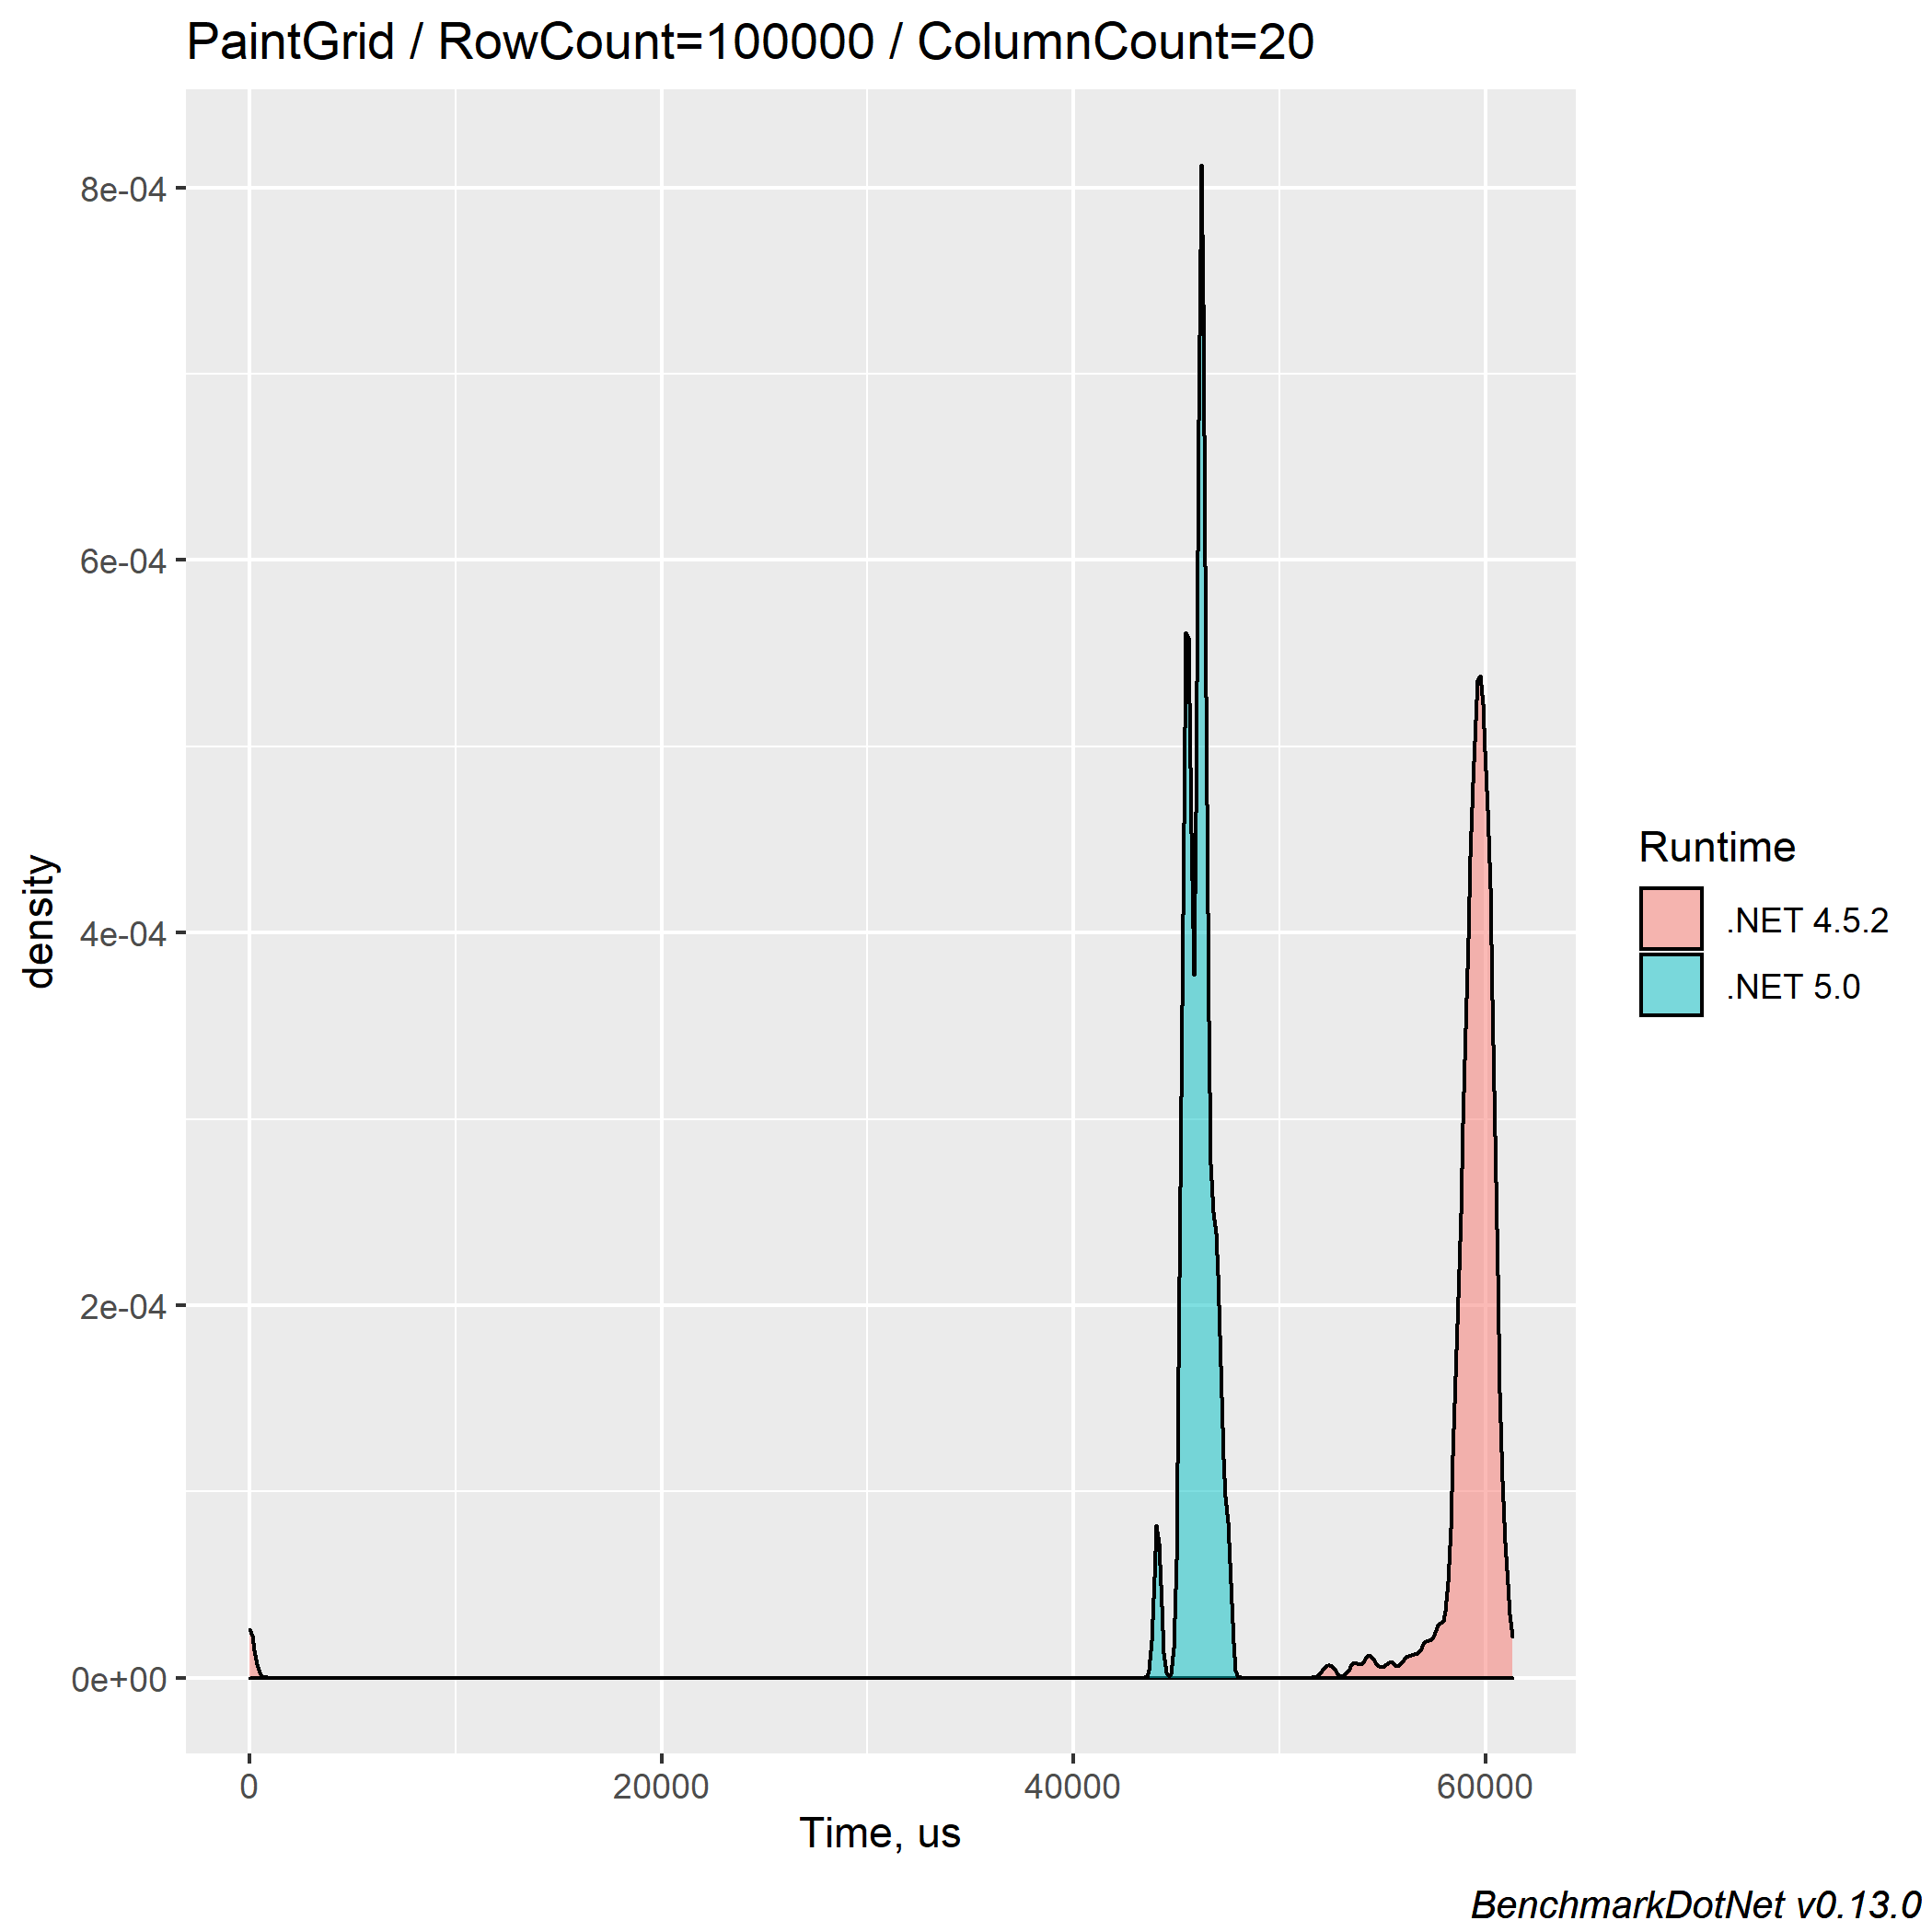
The density plots:
For 10000 rows:
For 100000 rows:
For 1000000 rows:
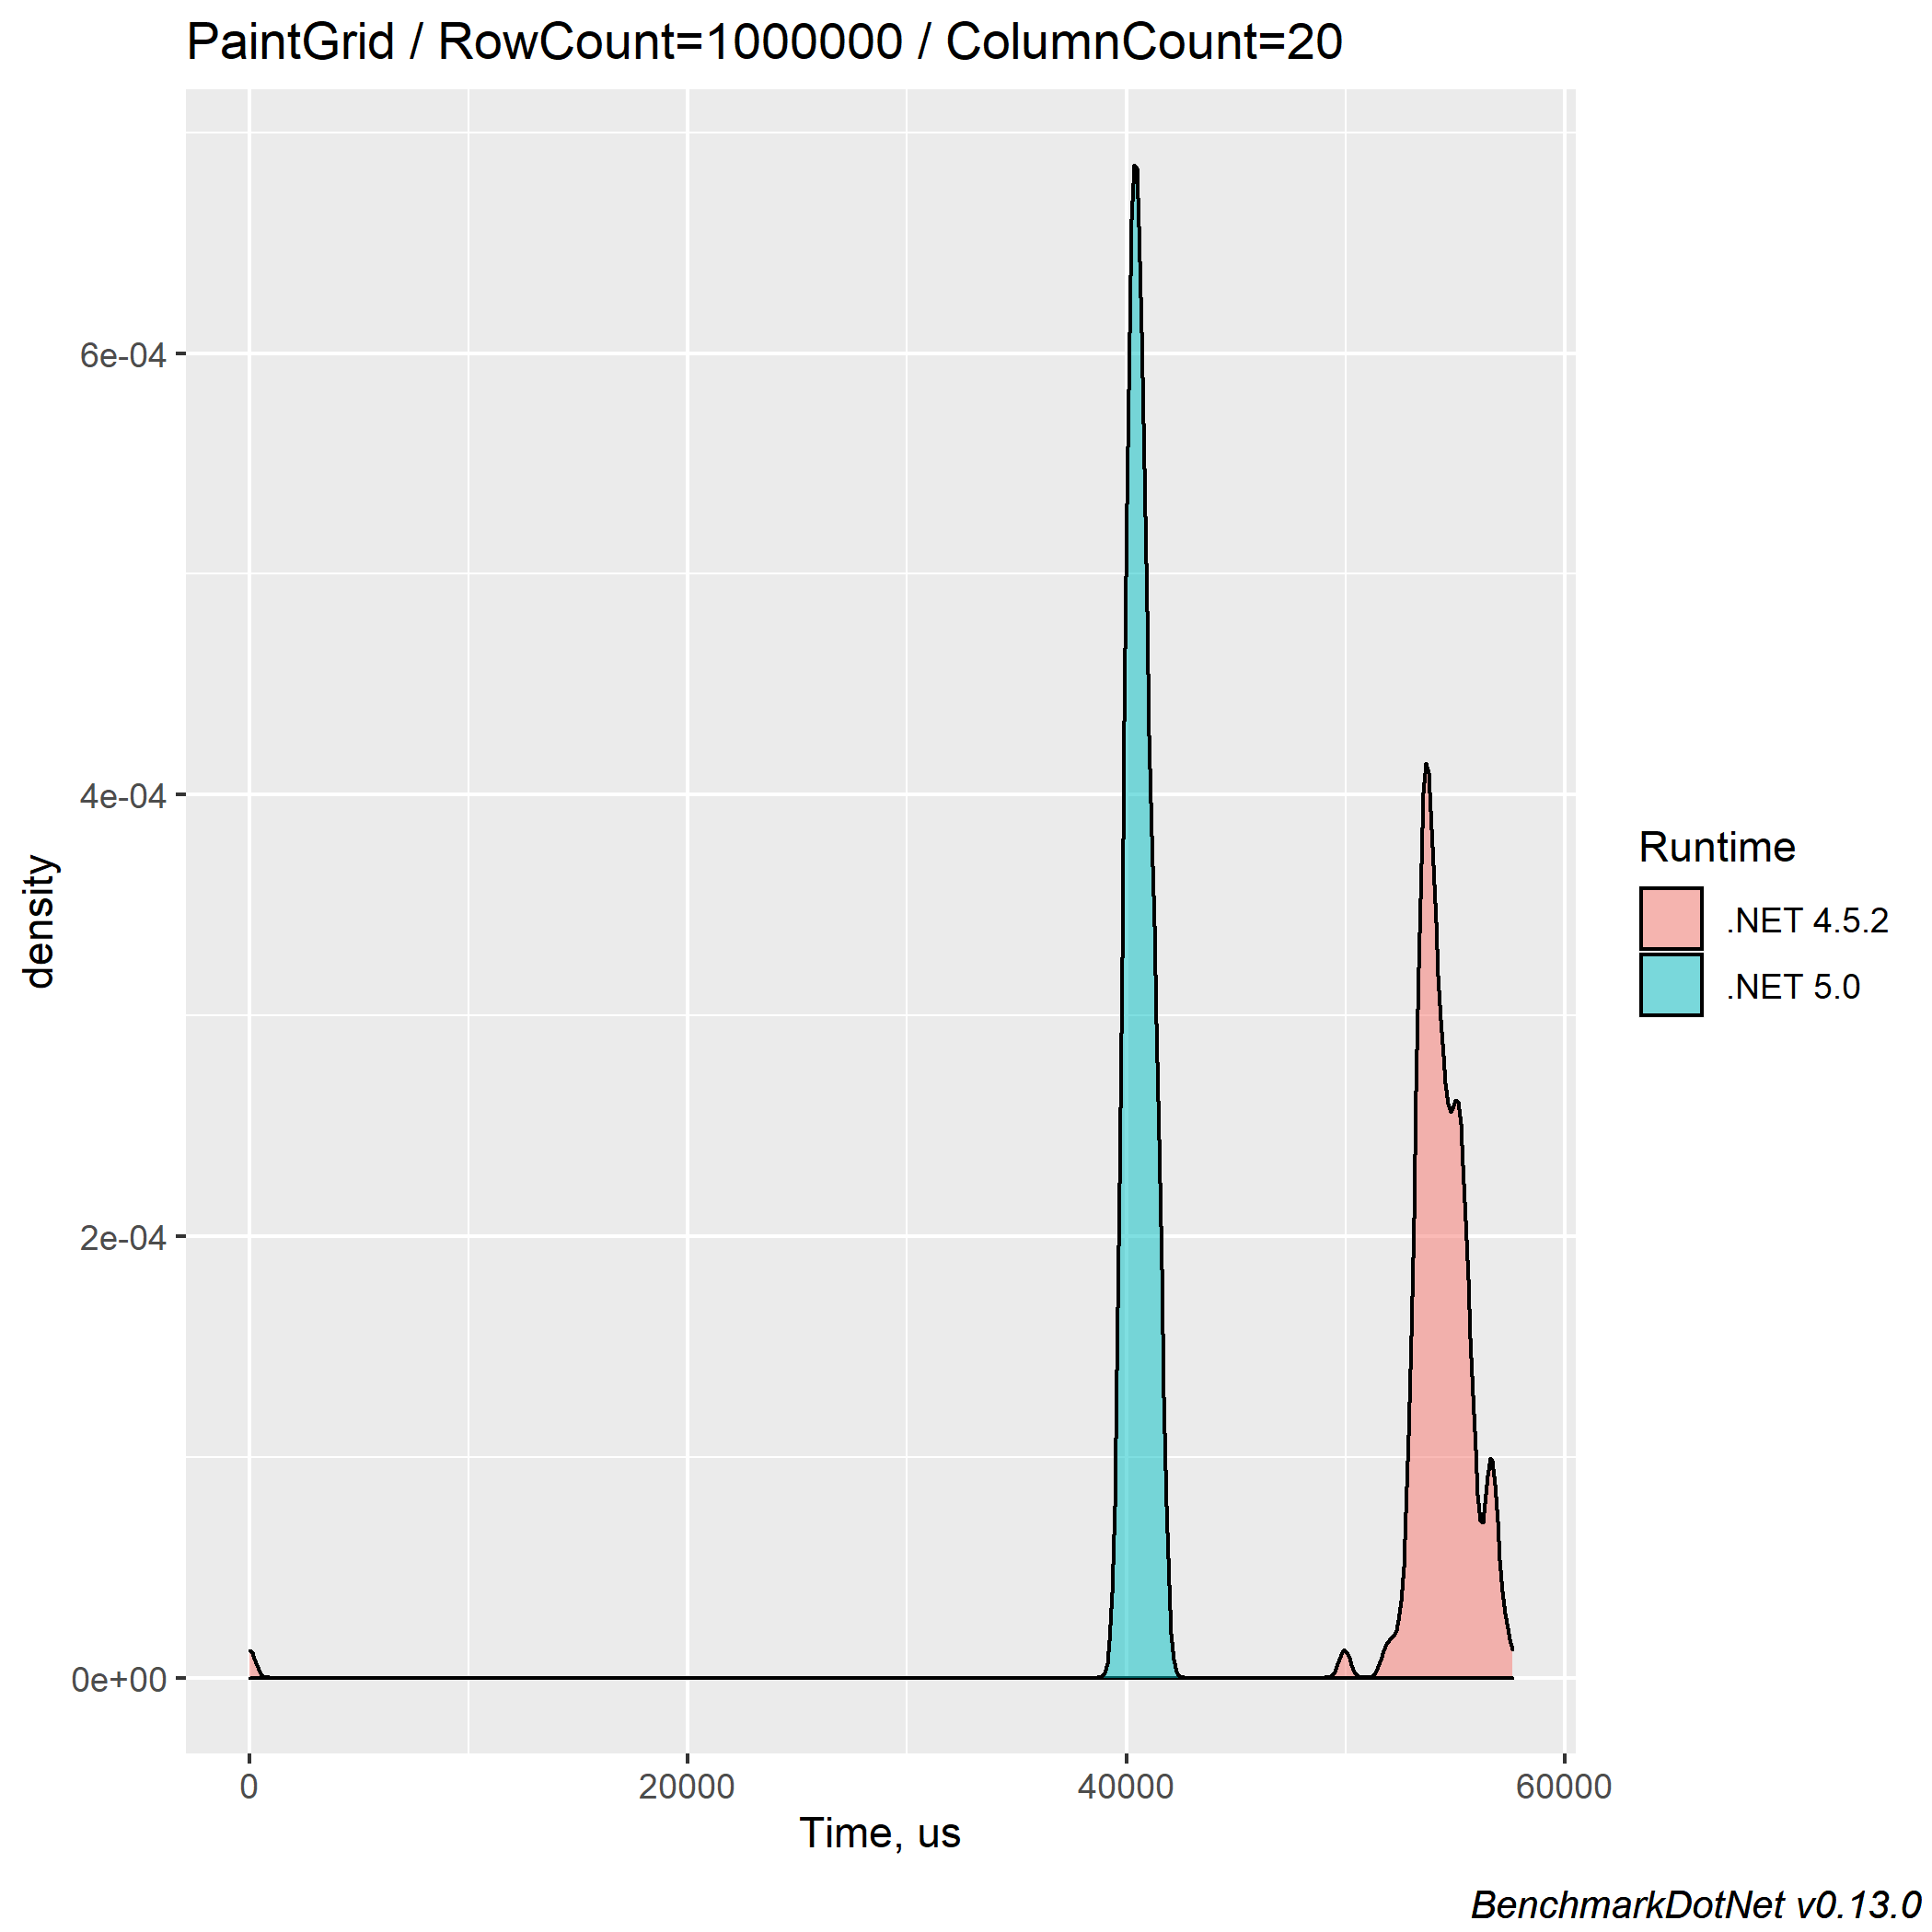
Each time, the .NET 5 version is faster than .NET Framework 4.5.2. The performance gain is 28%, demonstrating that the .NET 5 version paints faster than the .NET Framework version by 1.3 times.
Painting is the most used operation that occurs for UI control, occurring after every user operation. For example: for grid – data assigning, scrolling, filtering, grouping, row/column/data interactions, sometimes mouse moving. This performance boost means that the end-users will see the data after one or another operation faster for .NET 5 FlexGrid application than the .NET Framework 4.5.2+ application.
Also, the painting of .NET 5 FlexGrid requires about 3 times less memory than .NET Framework 4.5.2.
Scrolling 100 Rows
The next common operation performed by every user is scrolling.
To emulate scrolling behavior, we use FlexGrid’s ShowCell method. It calculates the scrolling positions which corresponds to the row and column parameters and sets the value to the scroll position:
[Benchmark]
public void Scroll100Rows()
{
    _flexGrid.ShowCell(100, _flexGrid.Cols.Fixed);
}
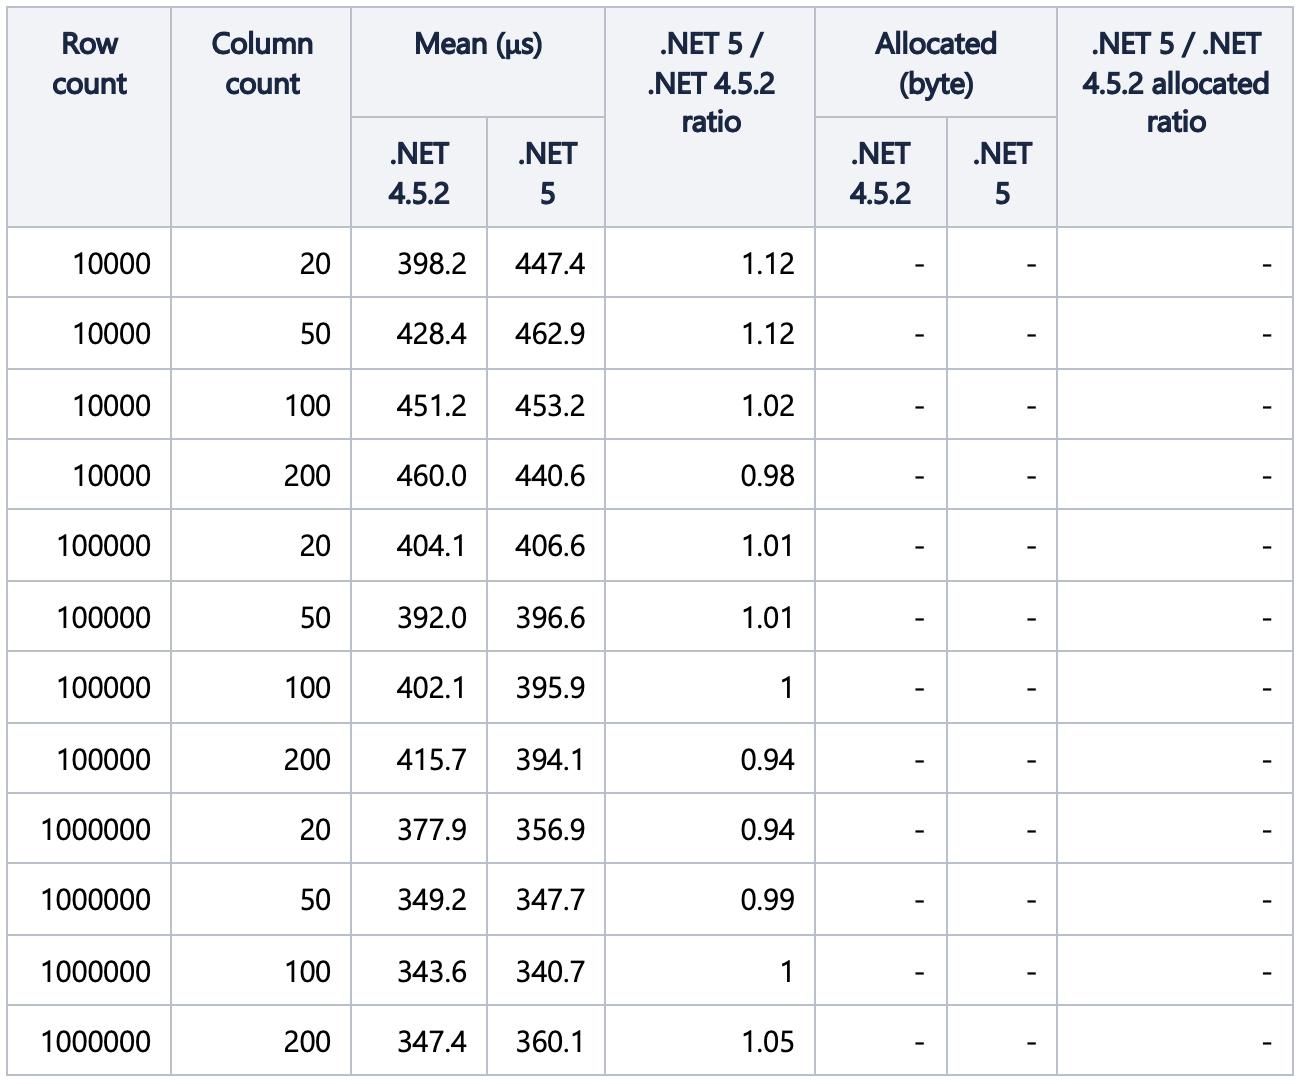
The summary table:
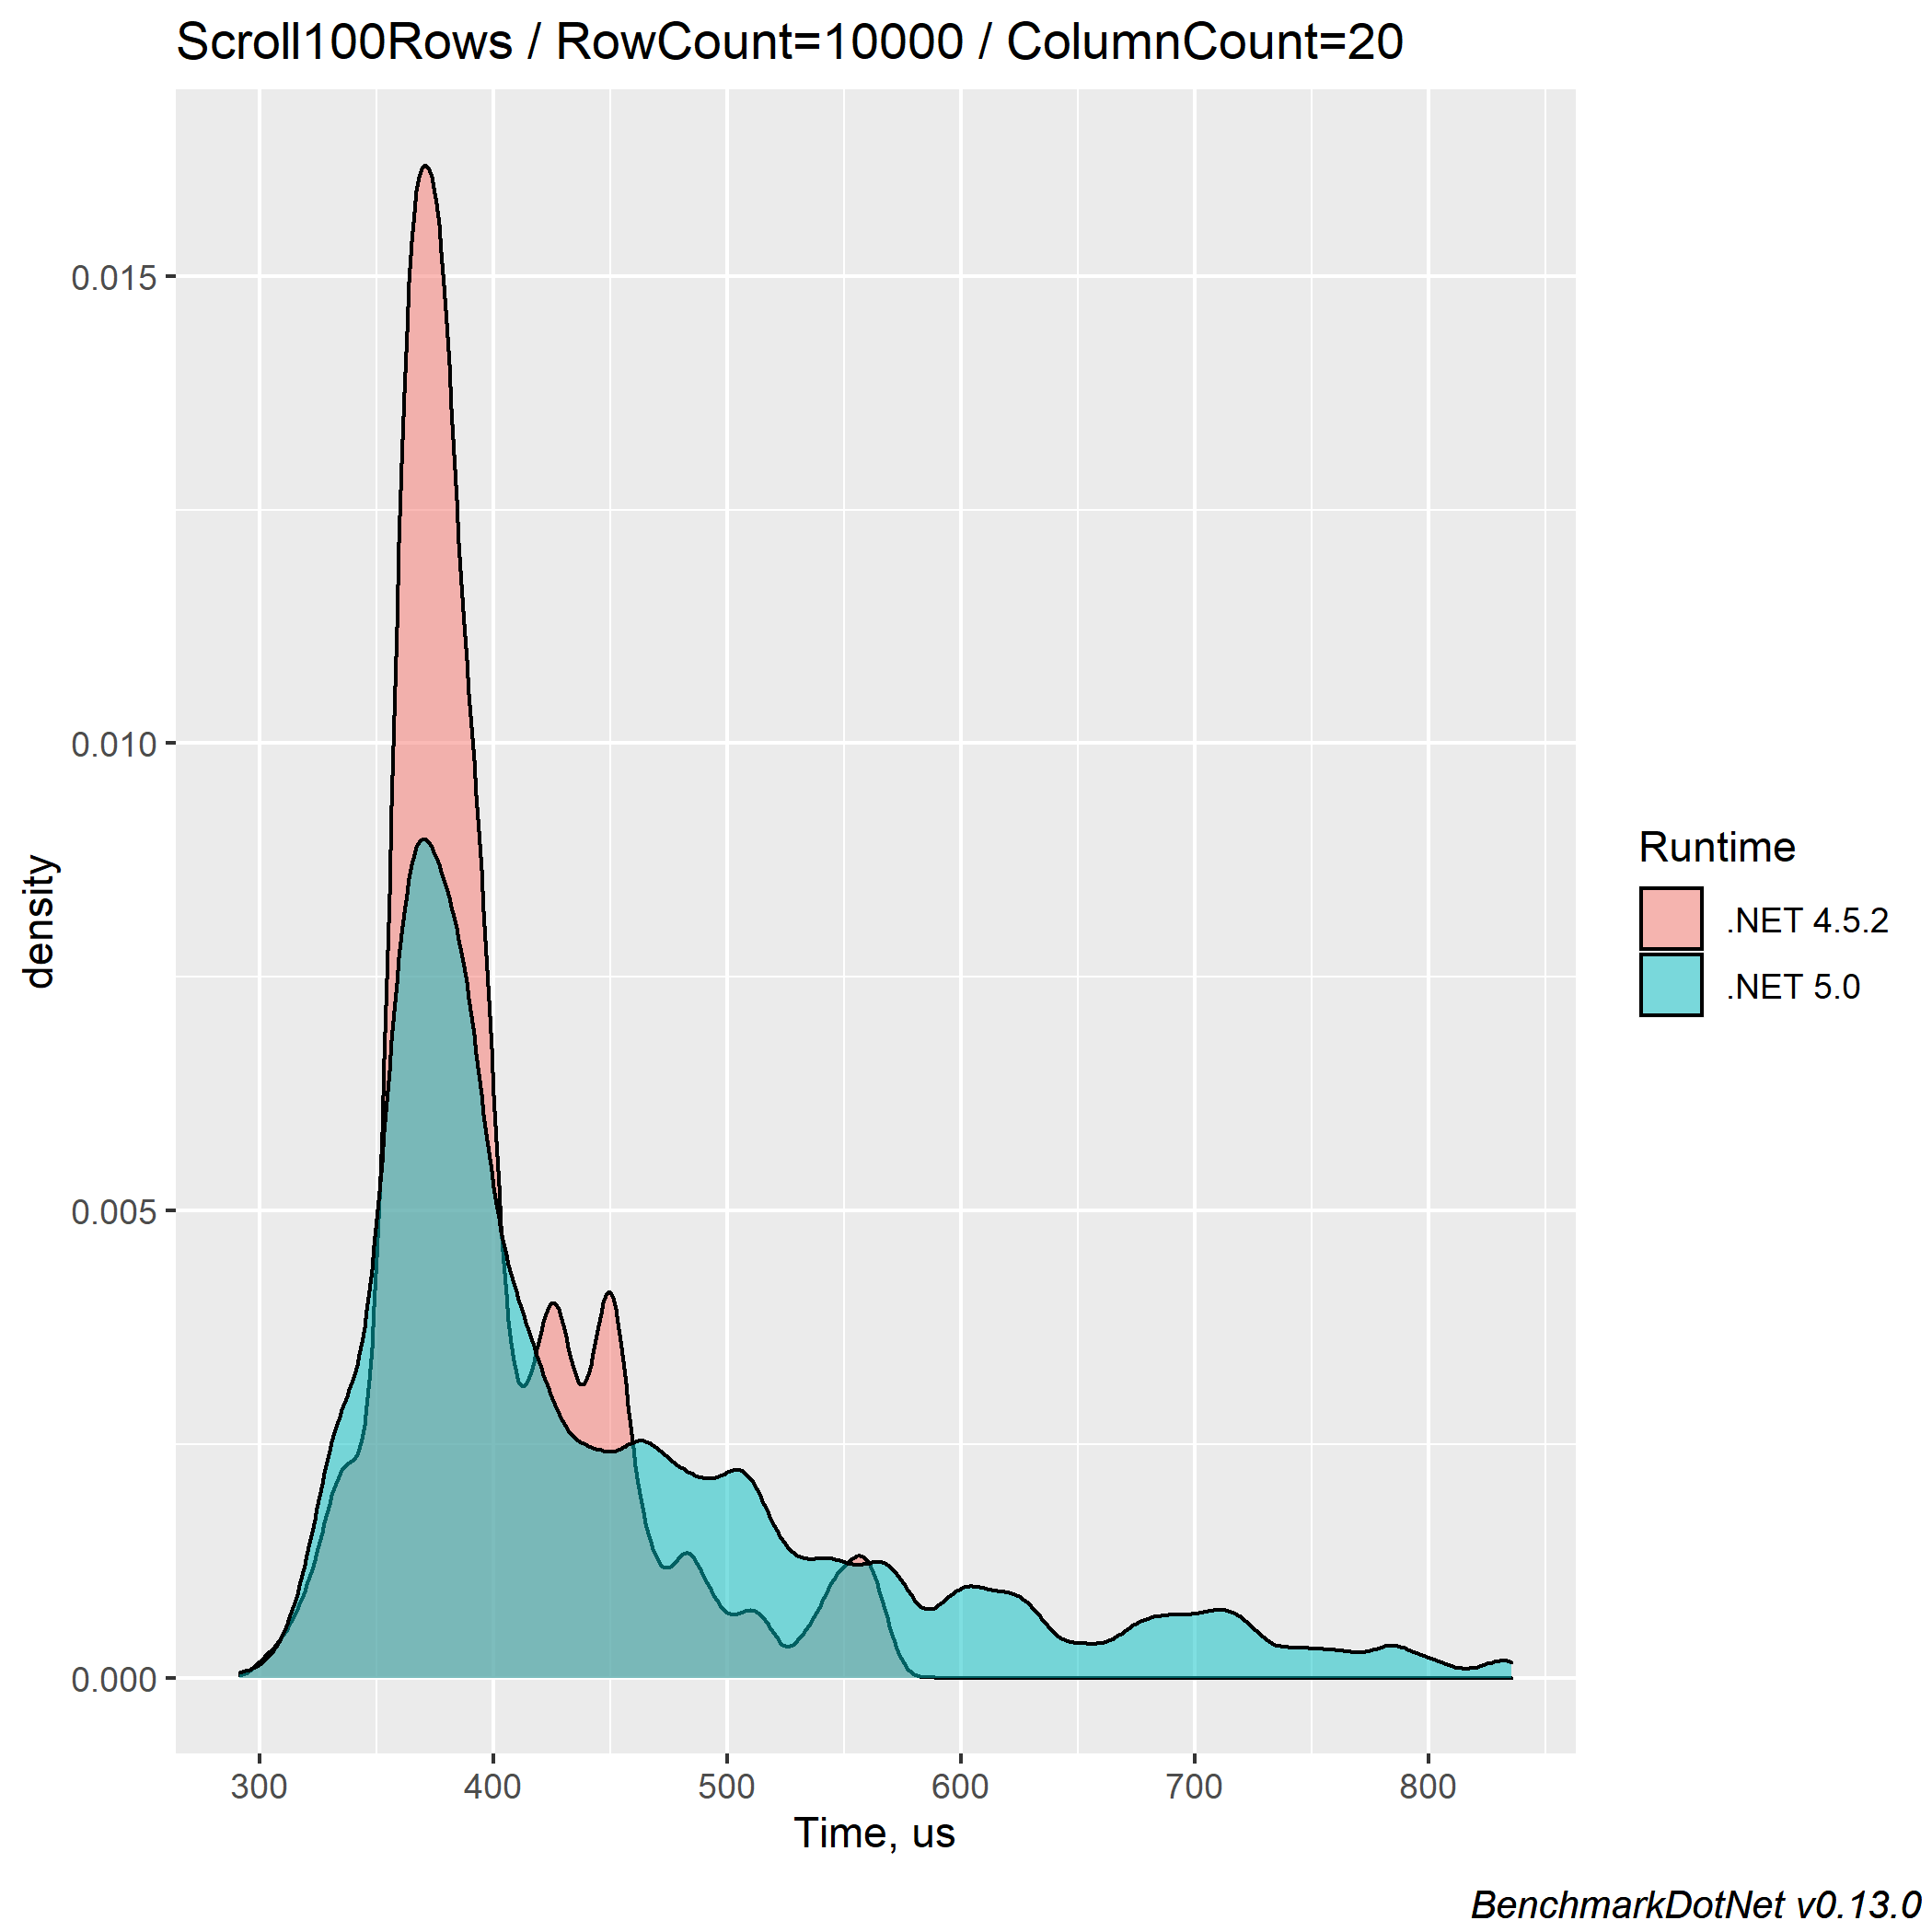
The density plots:
For 10000 rows:
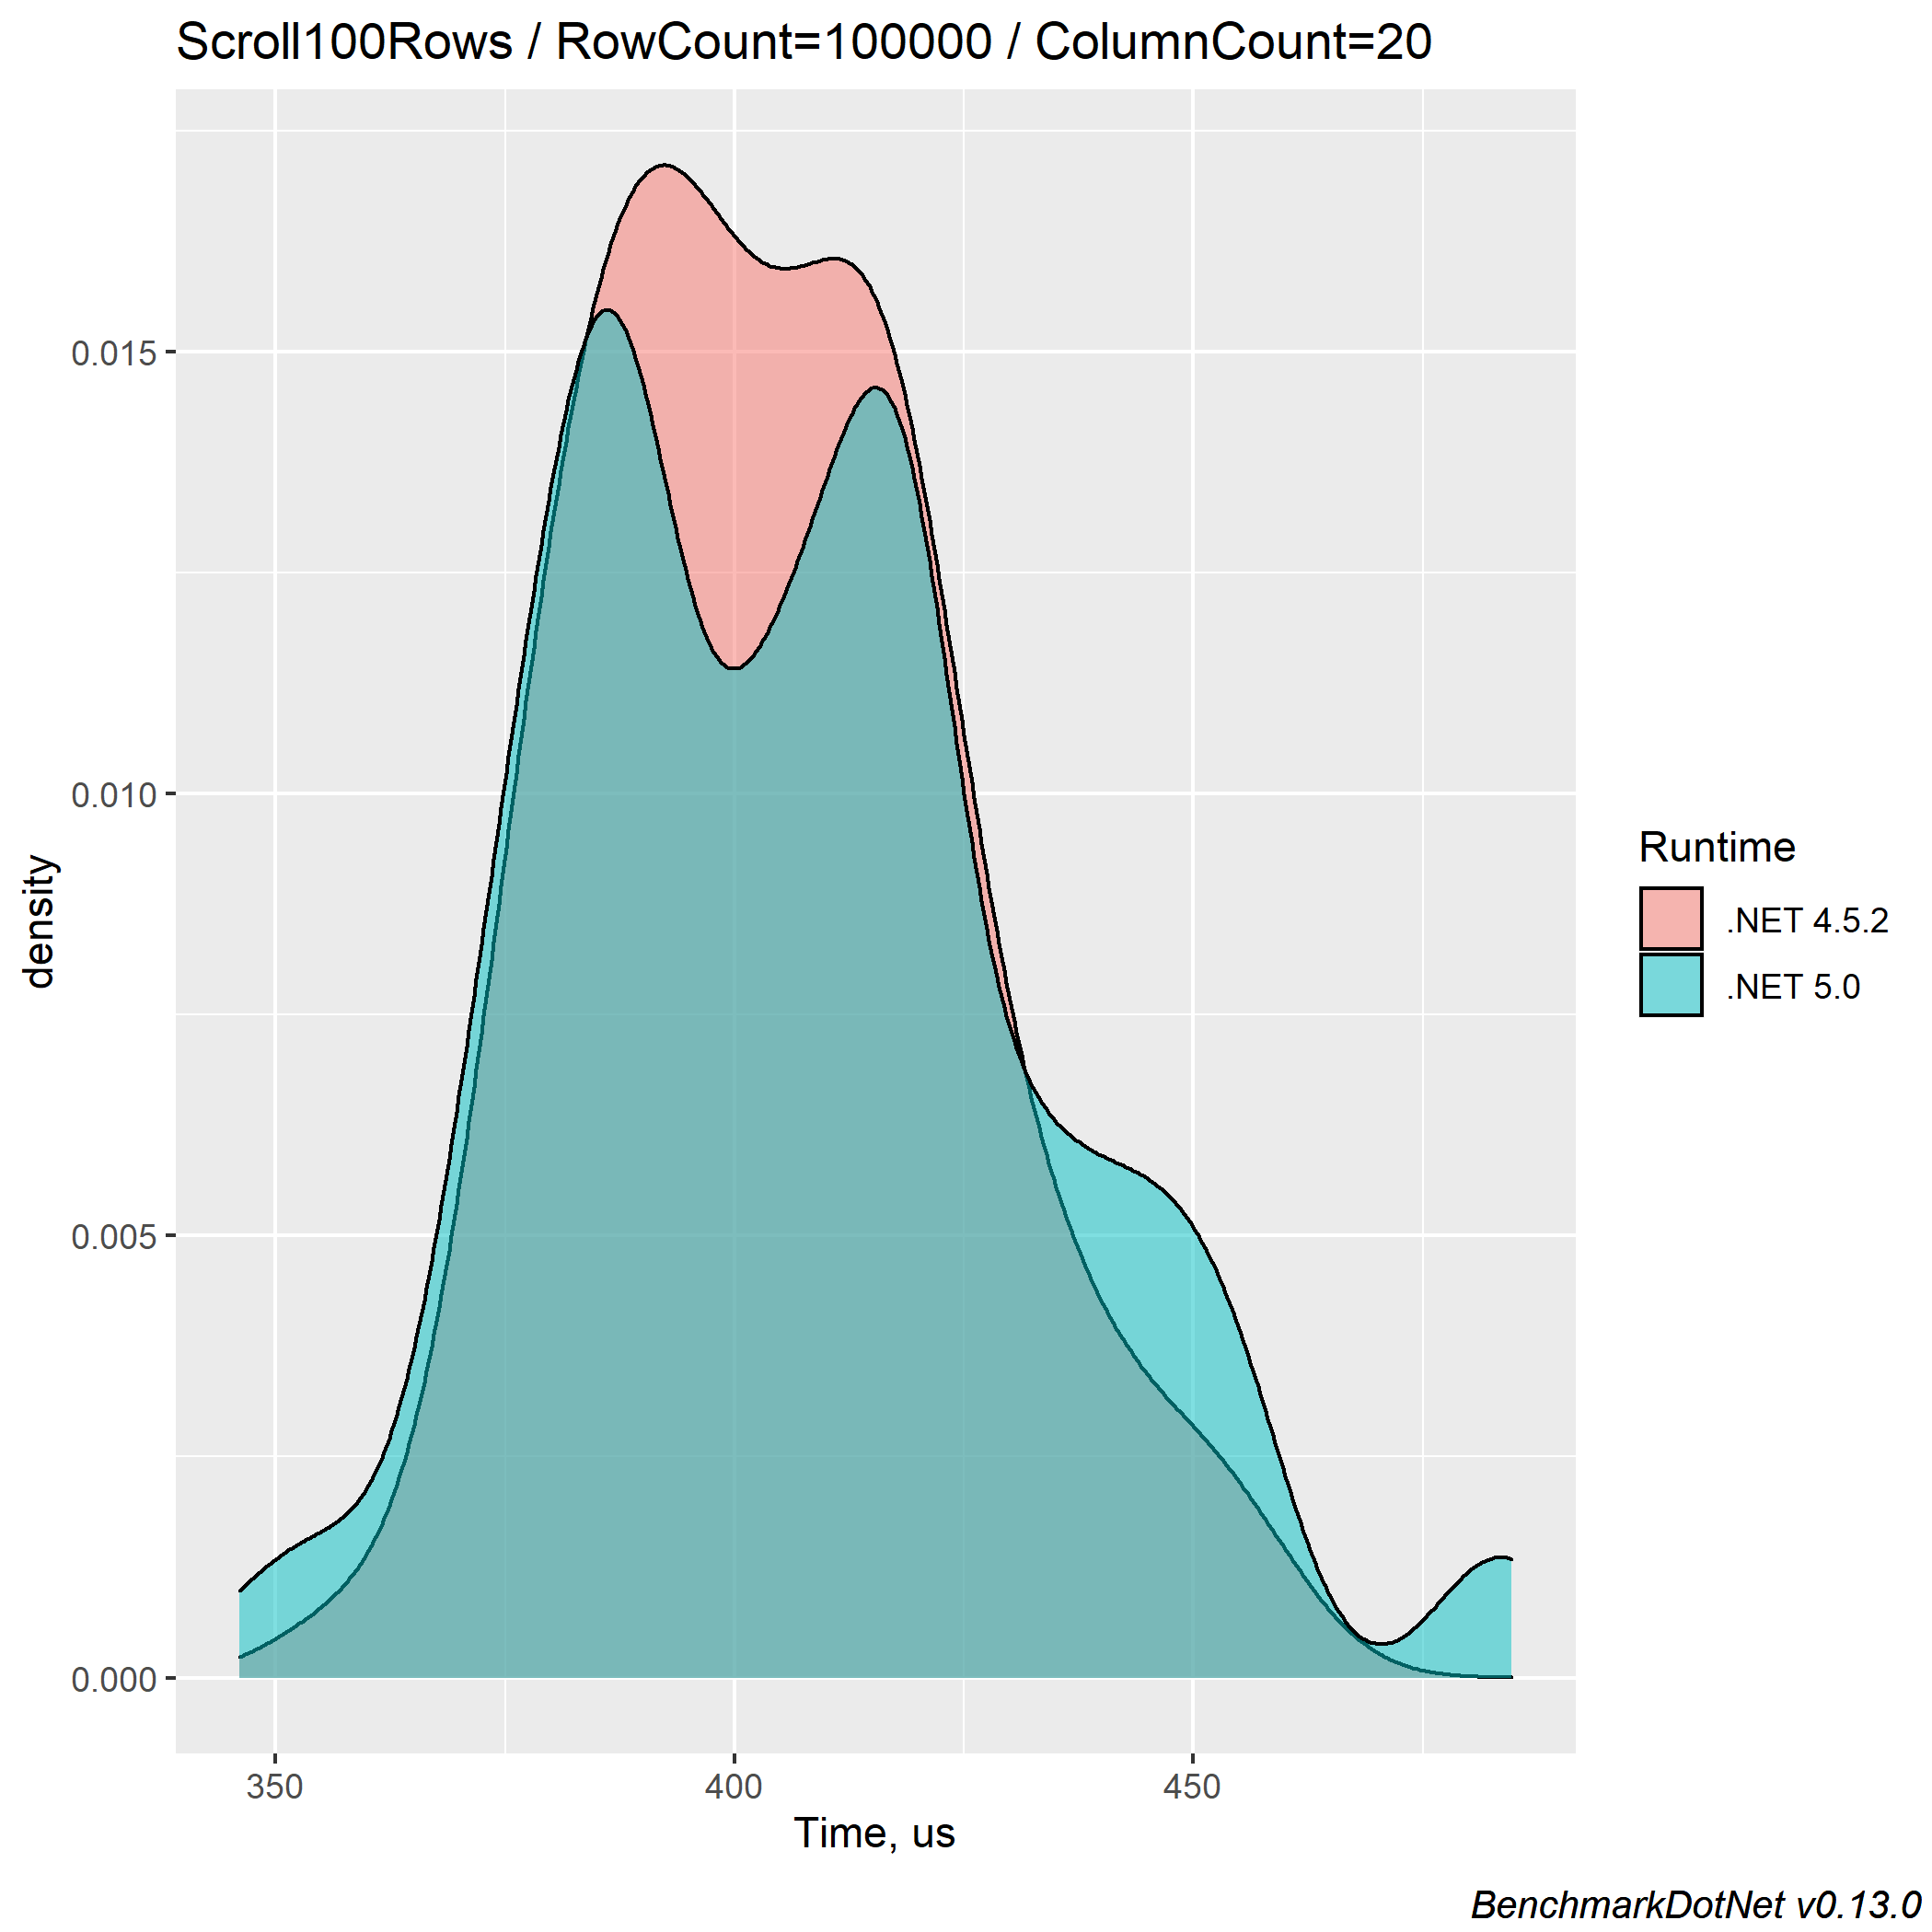
For 100000 rows:
For 100000 rows:
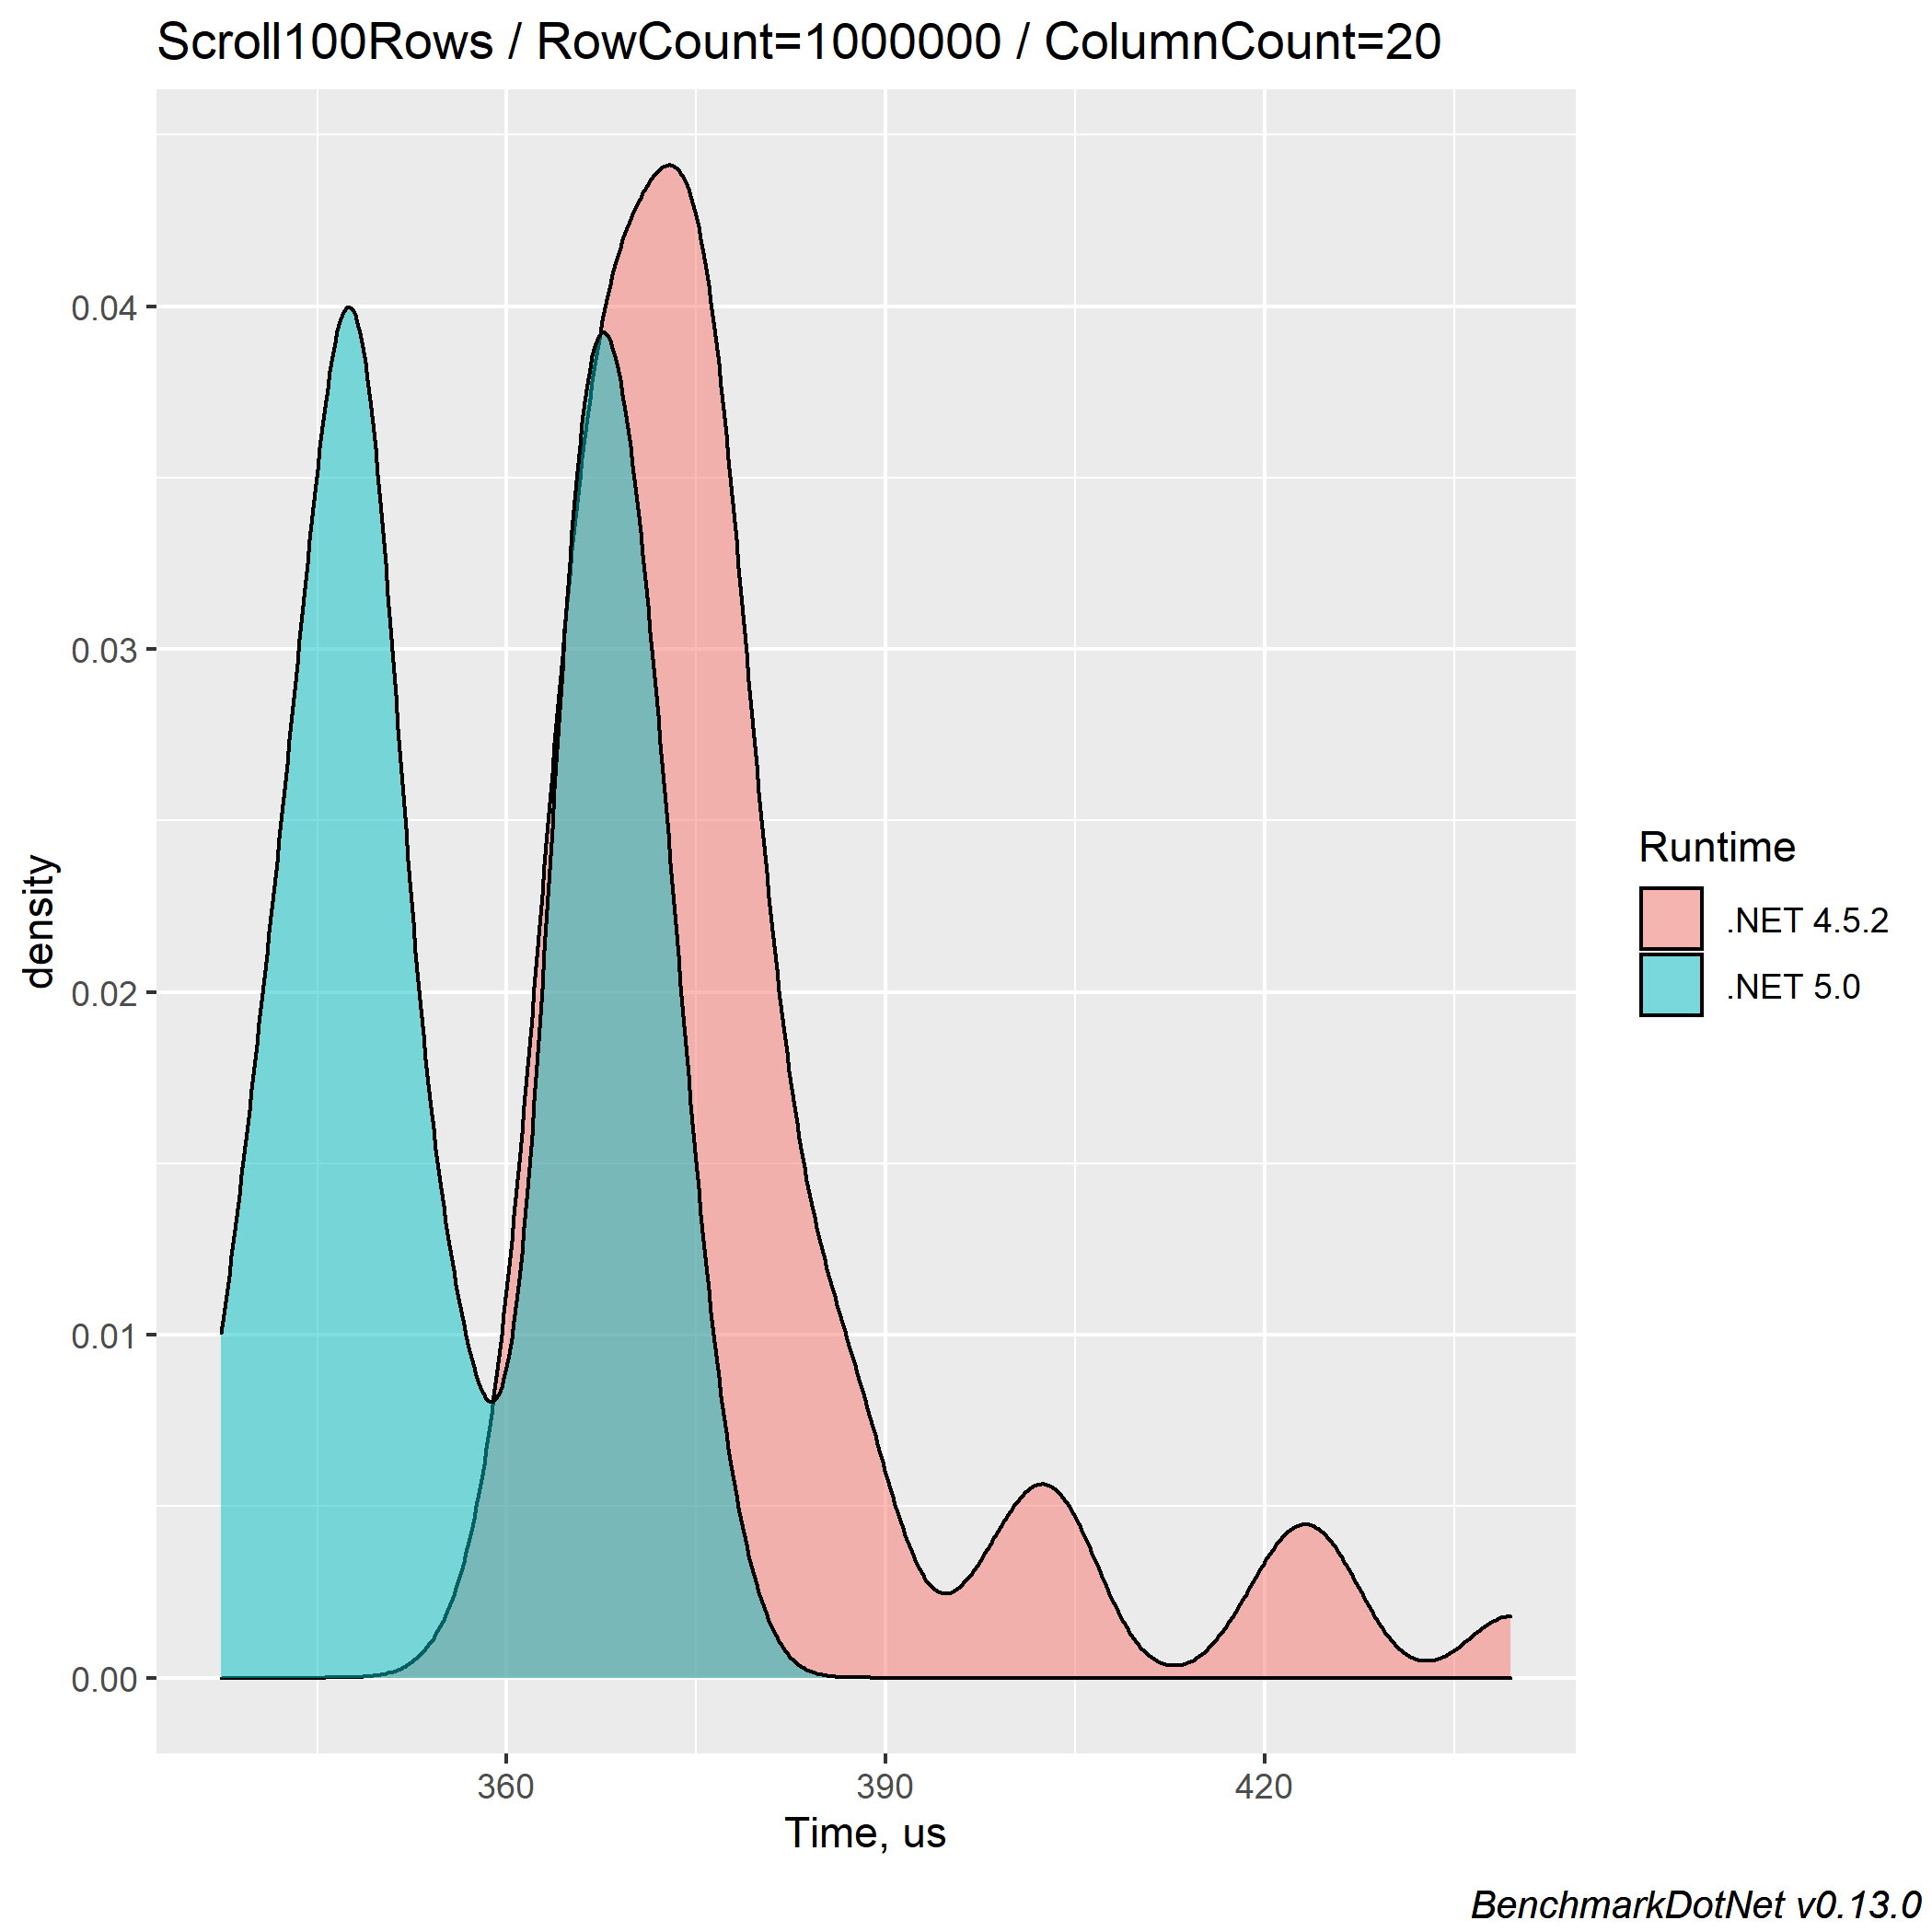
Here we can see that in some cases, the .NET 5 version is faster, and vice versa. If the whole operation is about 0,0004406 milliseconds, in combination with painting, the scrolling for .NET 5 FlexGrid will be at least no slower than .NET 4.5.2.
The summary table does not show any allocation data. It may get interpreted that there are no memory allocations during scrolling operation, but such treatment might be wrong. According to Adam Sitnik’s blog post, BenchmarkDotNet uses GCAllocationTick event, which says, “Each time approximately 100 KB is allocated”.
The memory allocation information absence might mean that the scrolling operation allocates less than 100 KB of memory.
Scrolling All Rows
The next benchmark test measures the scrolling of the whole grid:
[Benchmark]
public void ScrollAllRows()
{
    _flexGrid.ShowCell(_flexGrid.Rows.Count - 1, _flexGrid.Cols.Fixed);
}
The summary table:
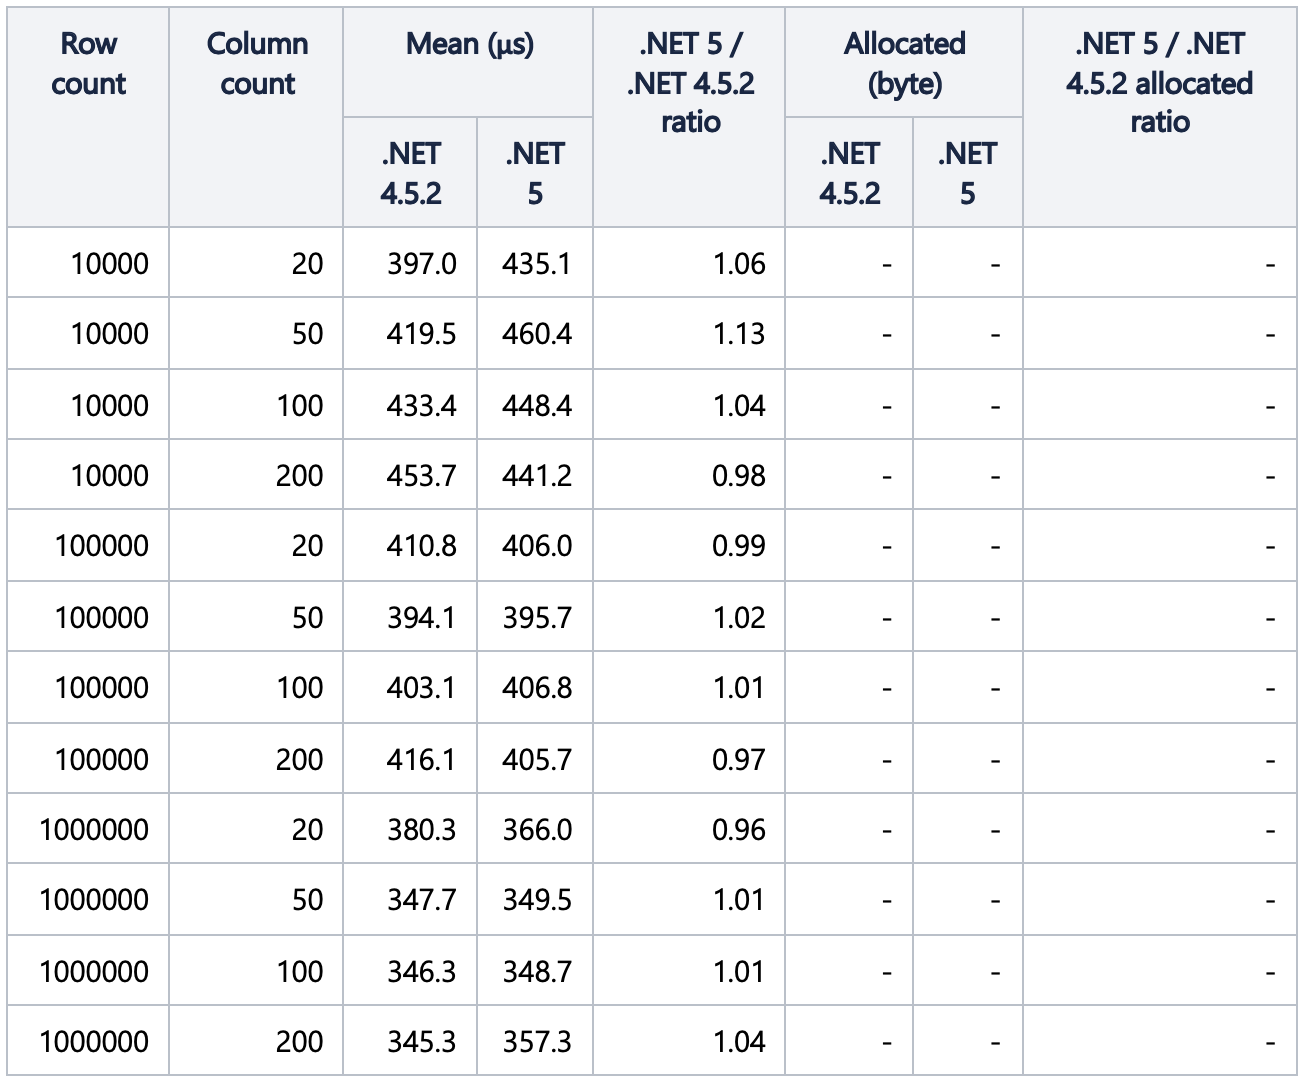
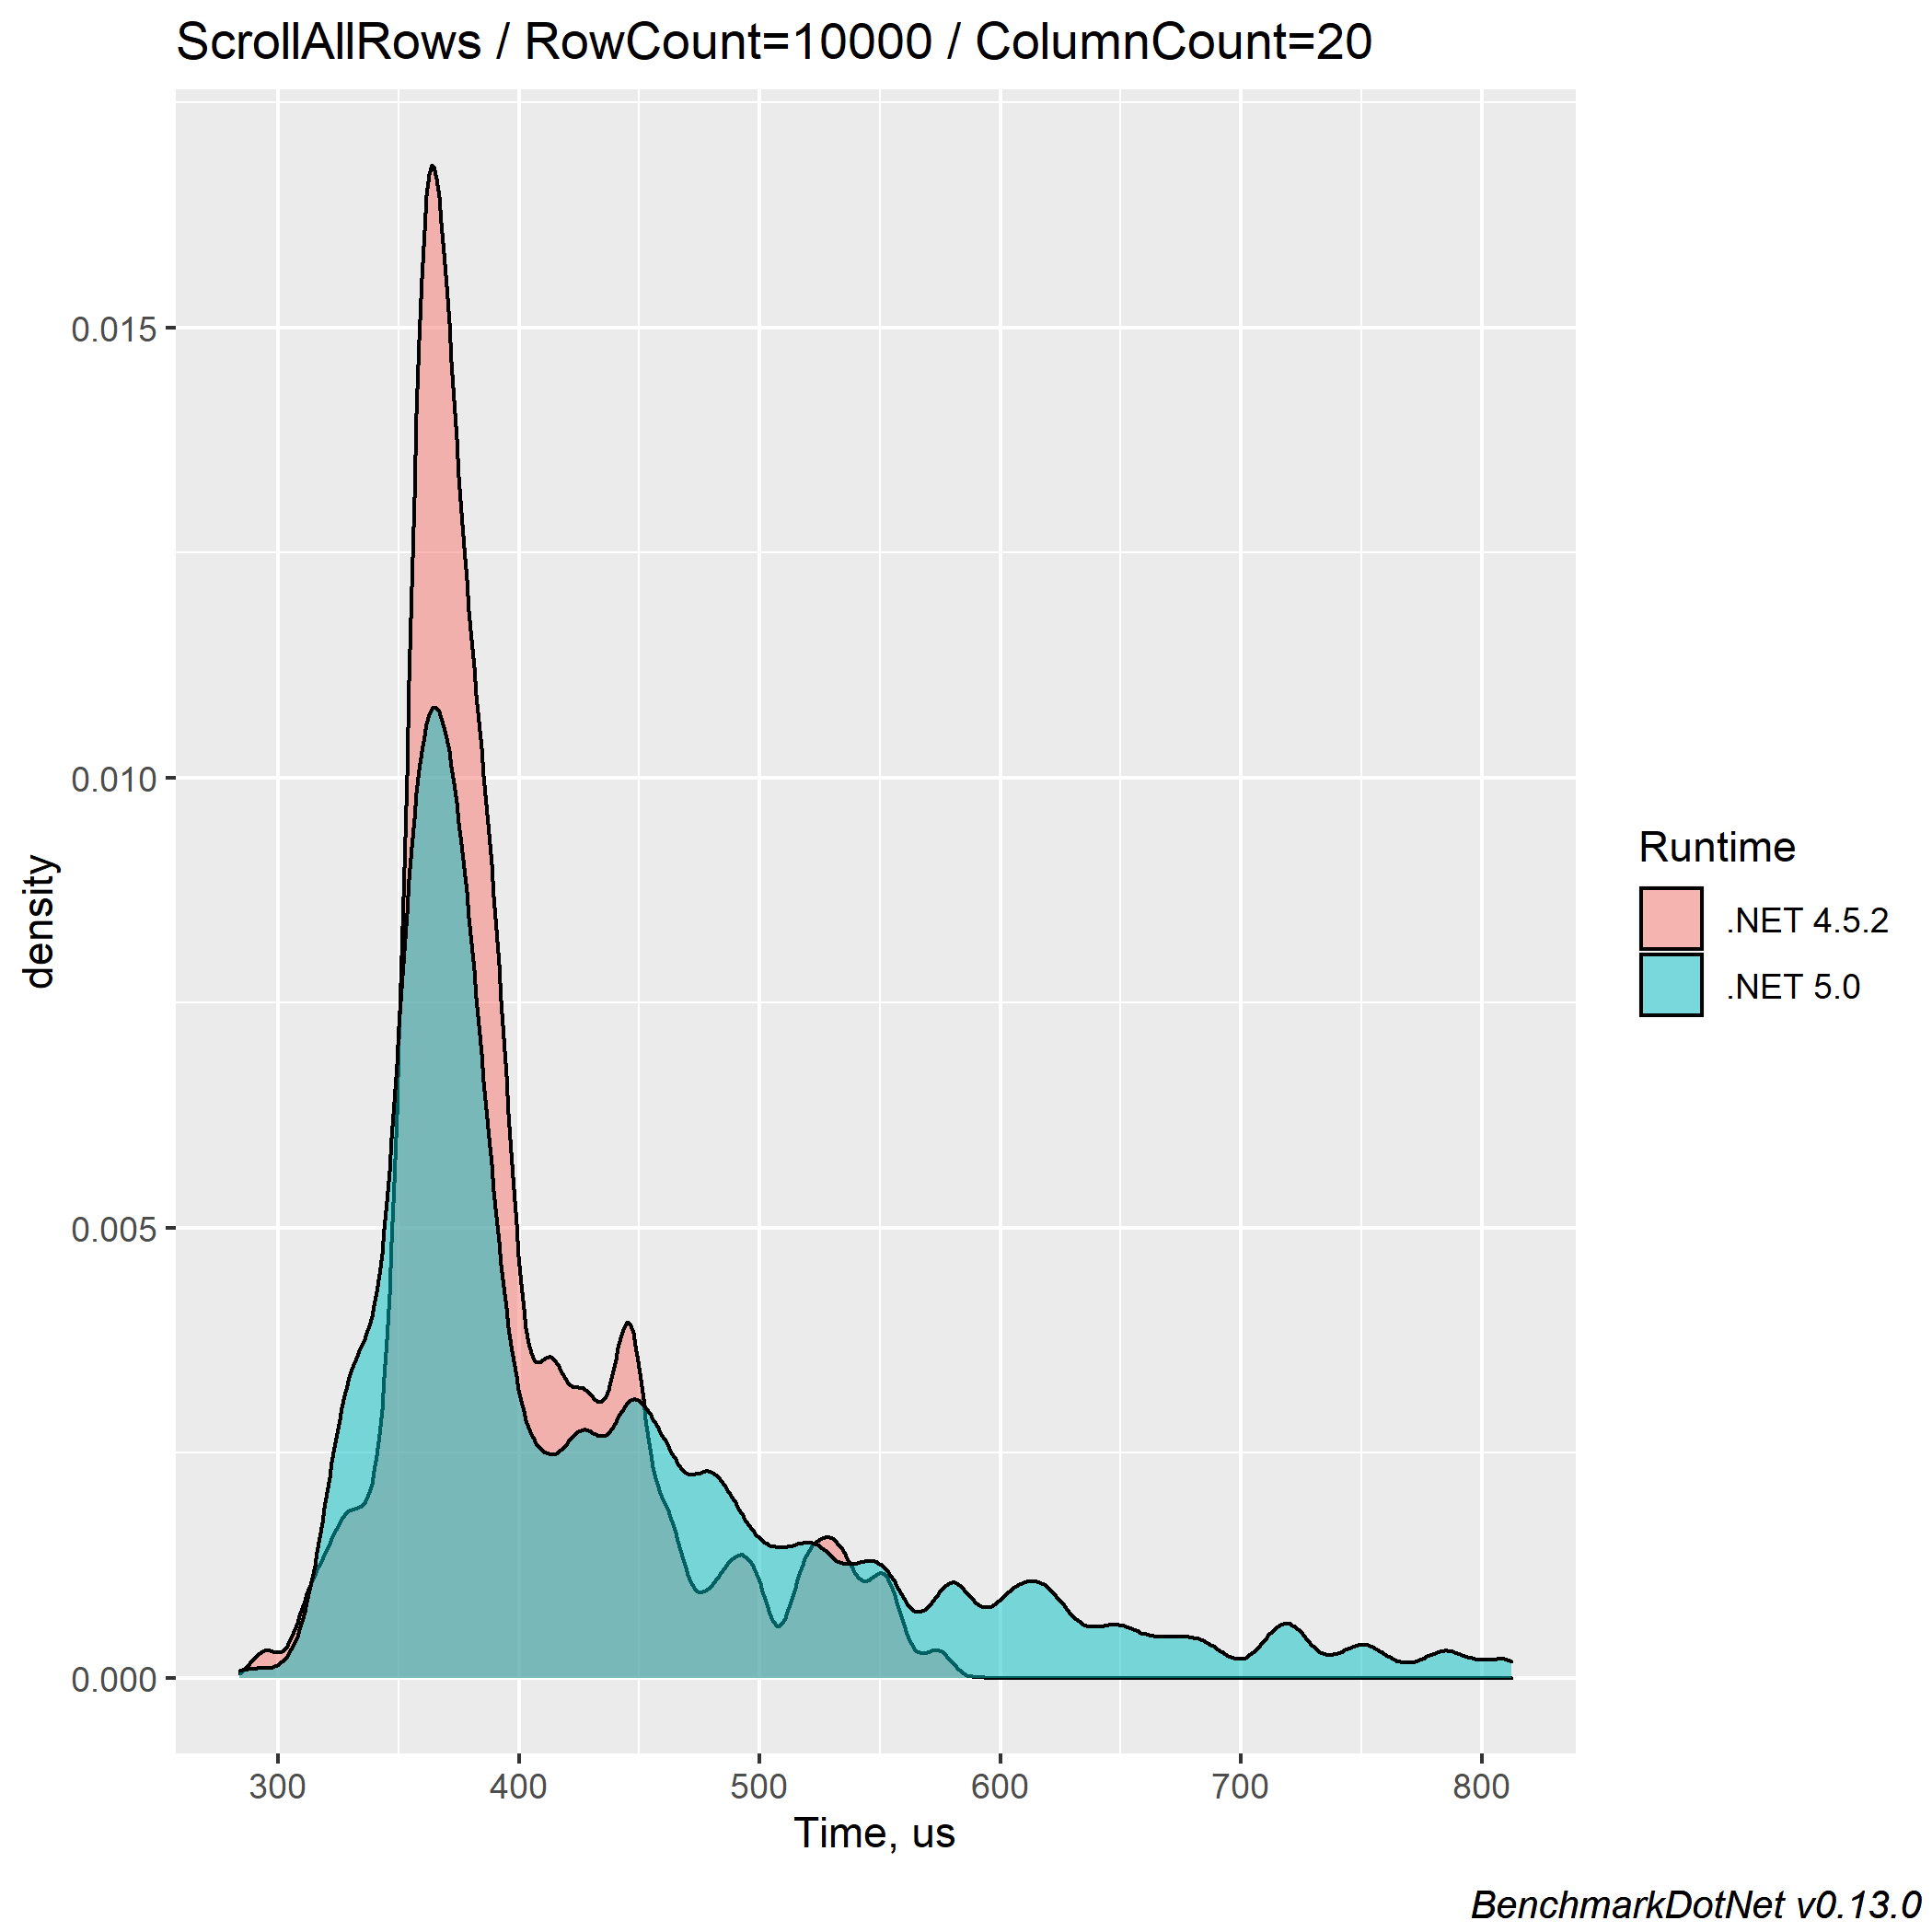
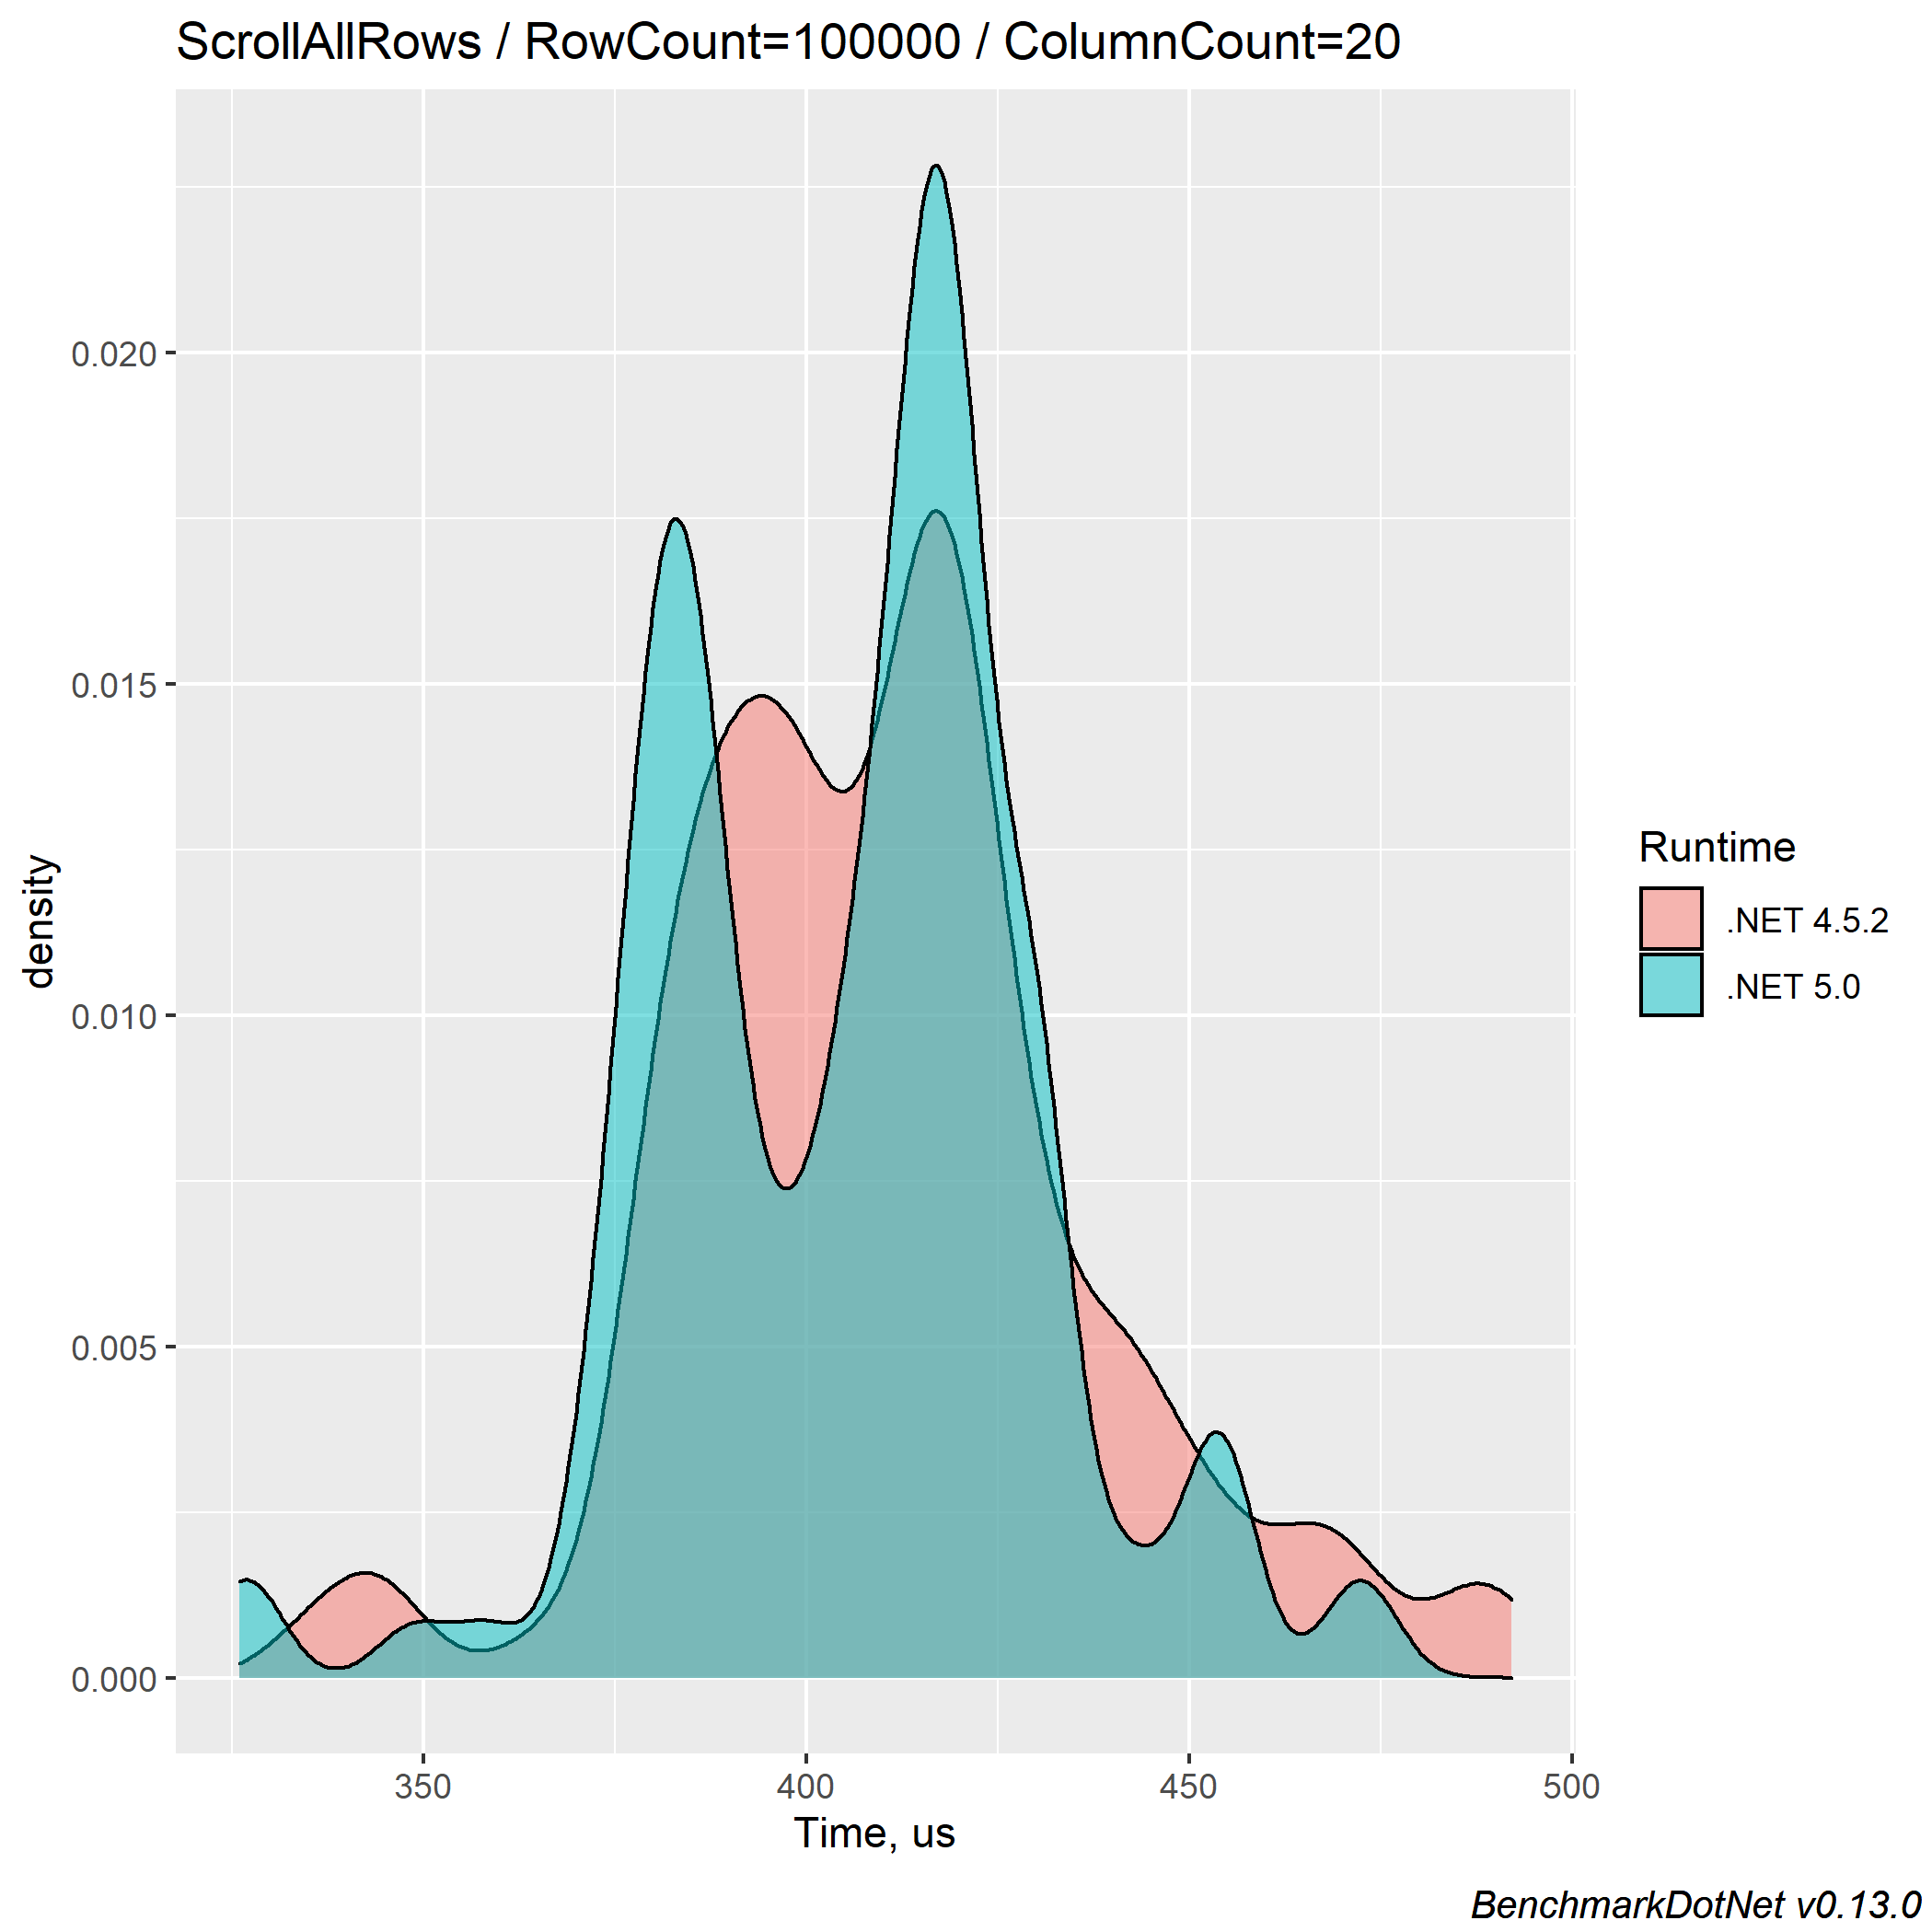
The density plots:
For 10000 rows:
For 100000 rows:
For 1000000 rows:
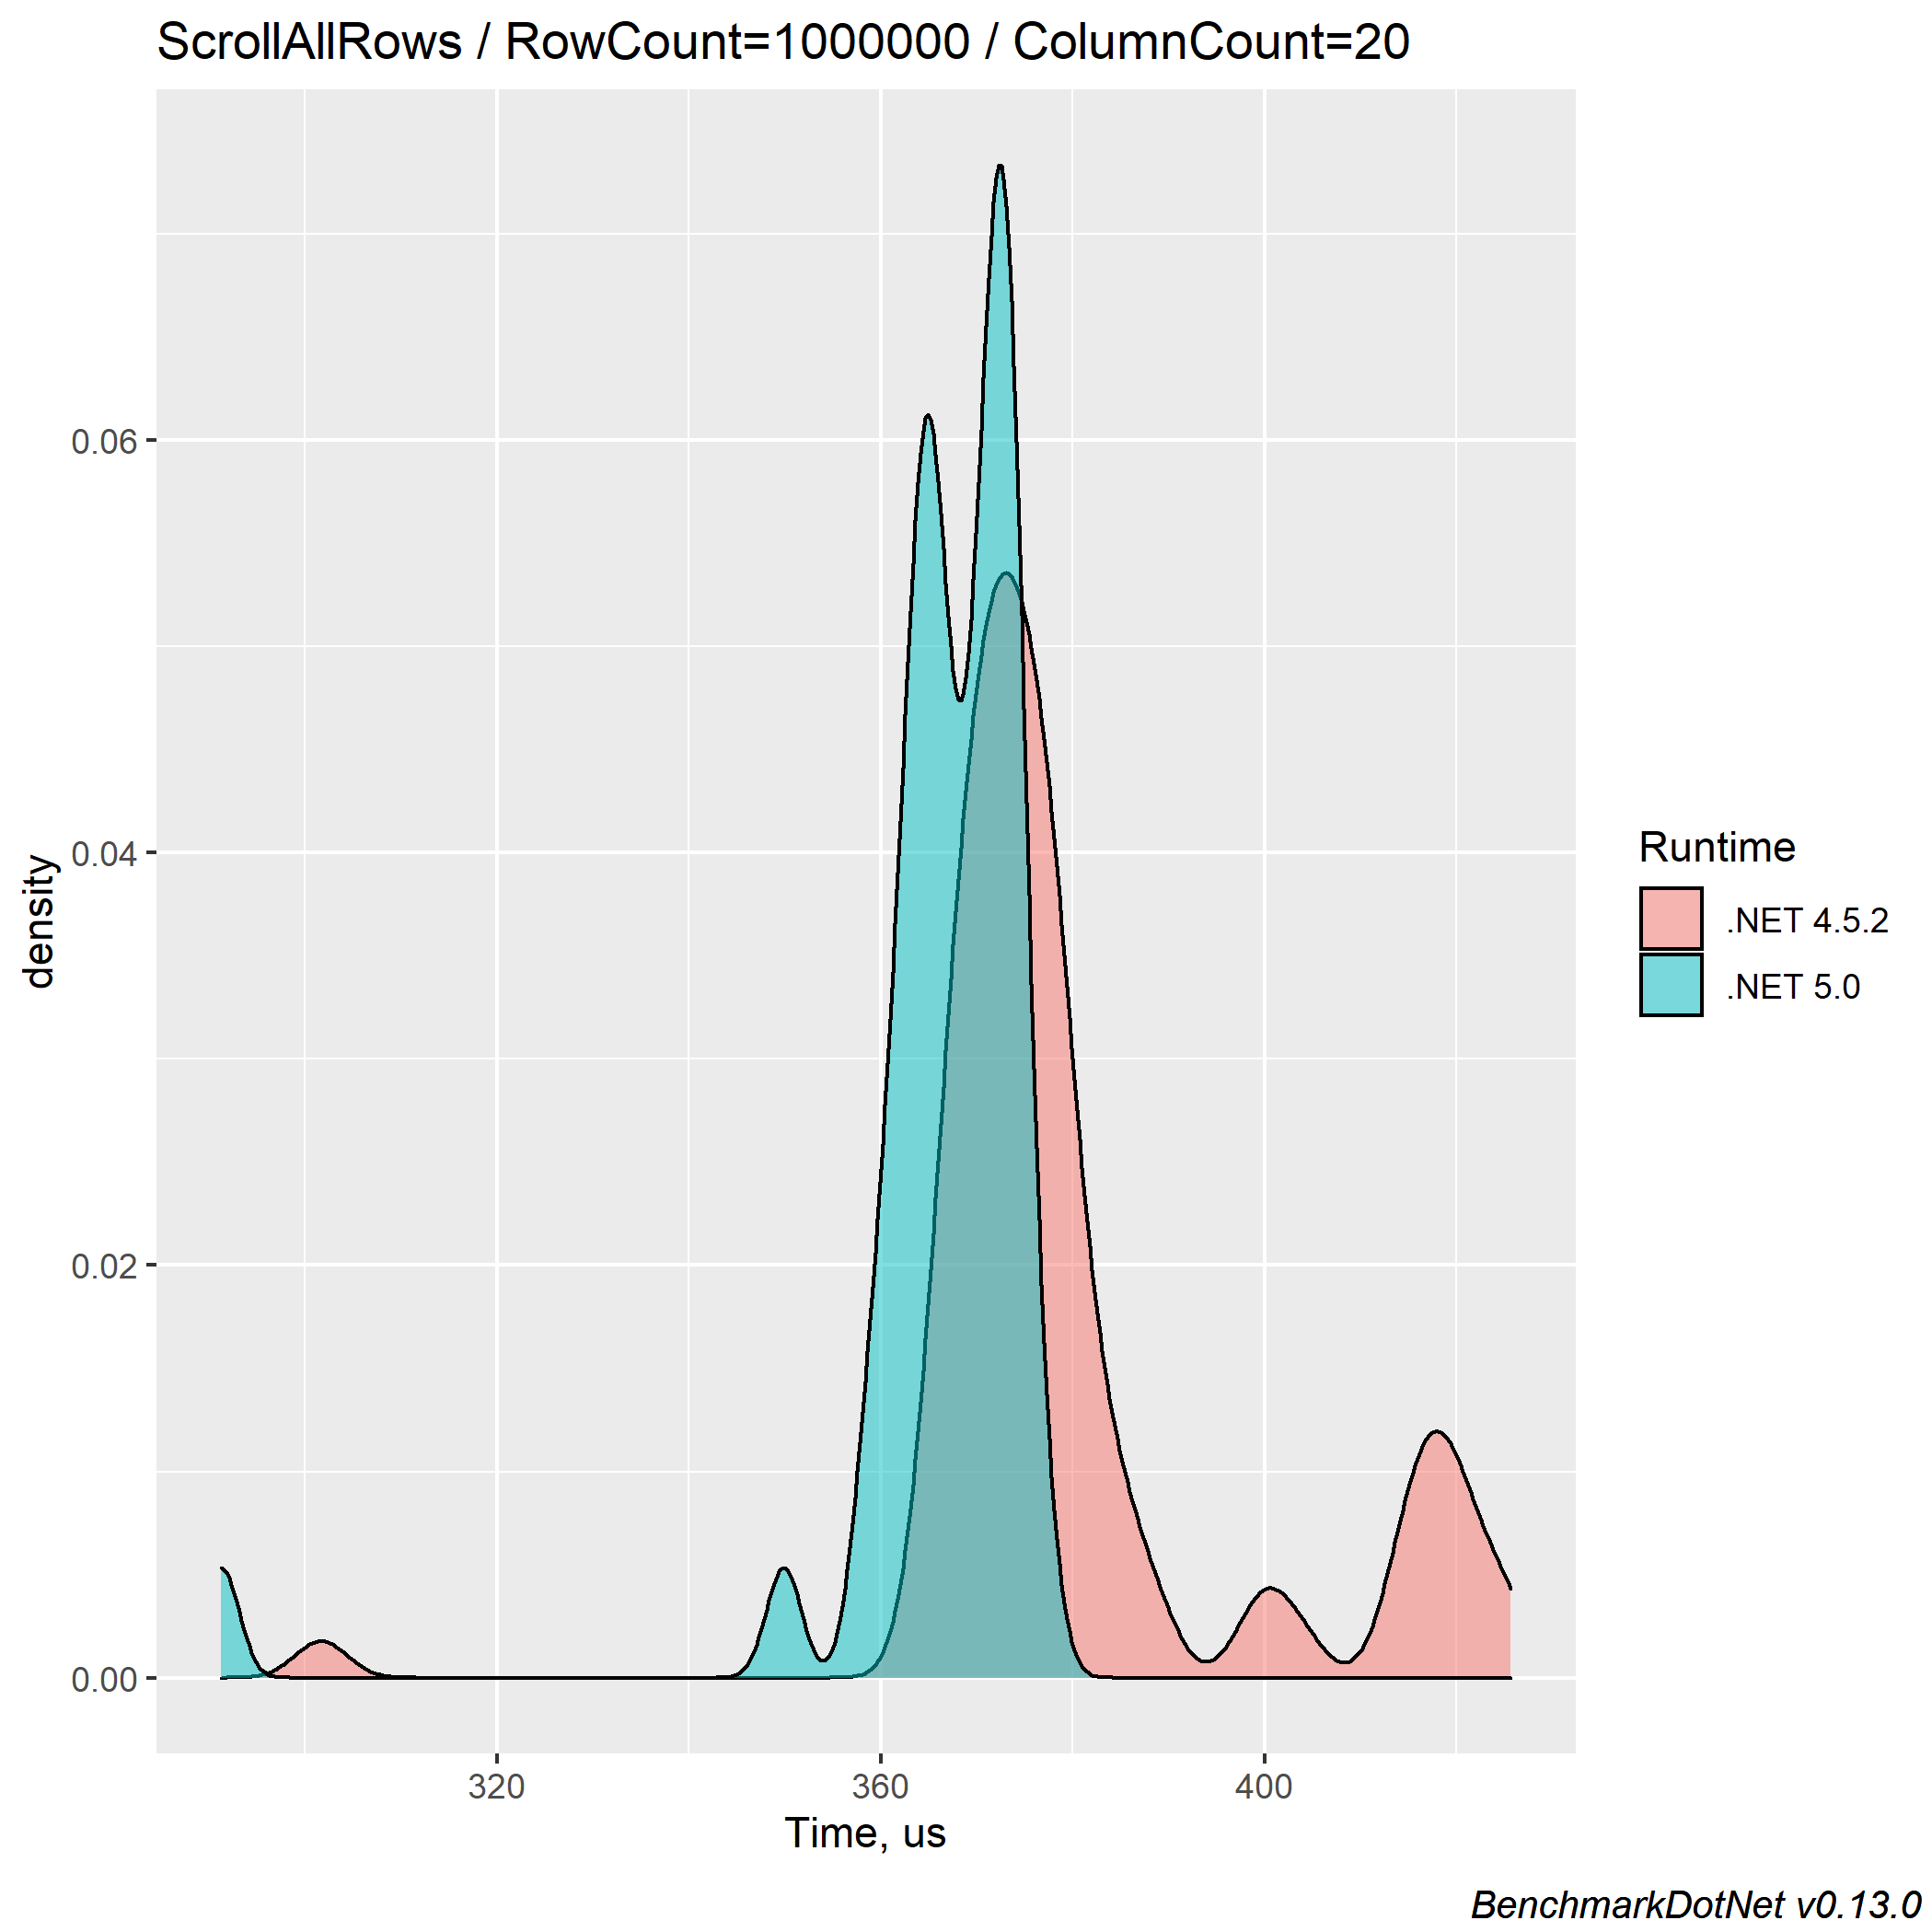
Here are some similar results to the scrolling of 100 rows – there is no absolute leader for such an operation. Again, the combination of painting the resulting grid and the scrolling for .NET 5 FlexGrid is at least no slower than .NET 4.5.2.
And like for the scrolling of 100 rows, for the whole grid scrolling, we cannot compare allocated memory values.
Sorting One Column
One of the common user interaction operations is sorting.
Since bound FlexGrid sorts the data source with its DefaultView.Sort property, we clear it at the end of the IterationCleanup stage to have a non-sorted grid for each iteration:
_data.DataTable.DefaultView.Sort = null;
The sorting operation can be performed this way:
[Benchmark]
public void SortColumn()
{
    _flexGrid.Sort(SortFlags.Ascending, _flexGrid.Cols.Fixed);
}
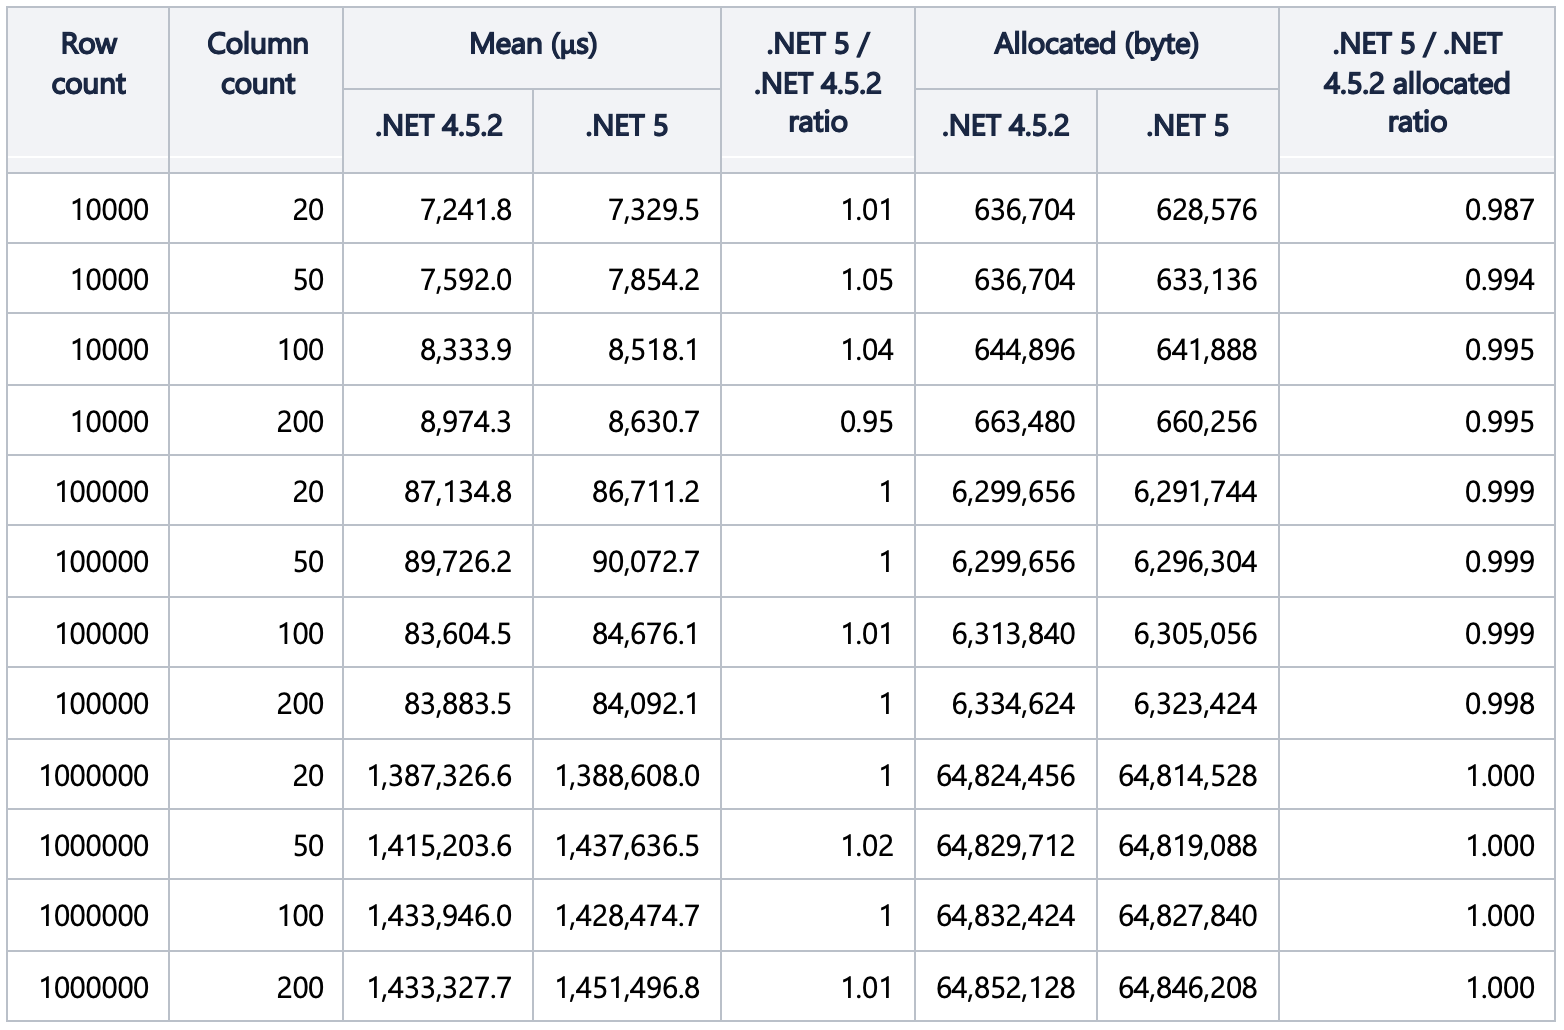
The summary table:
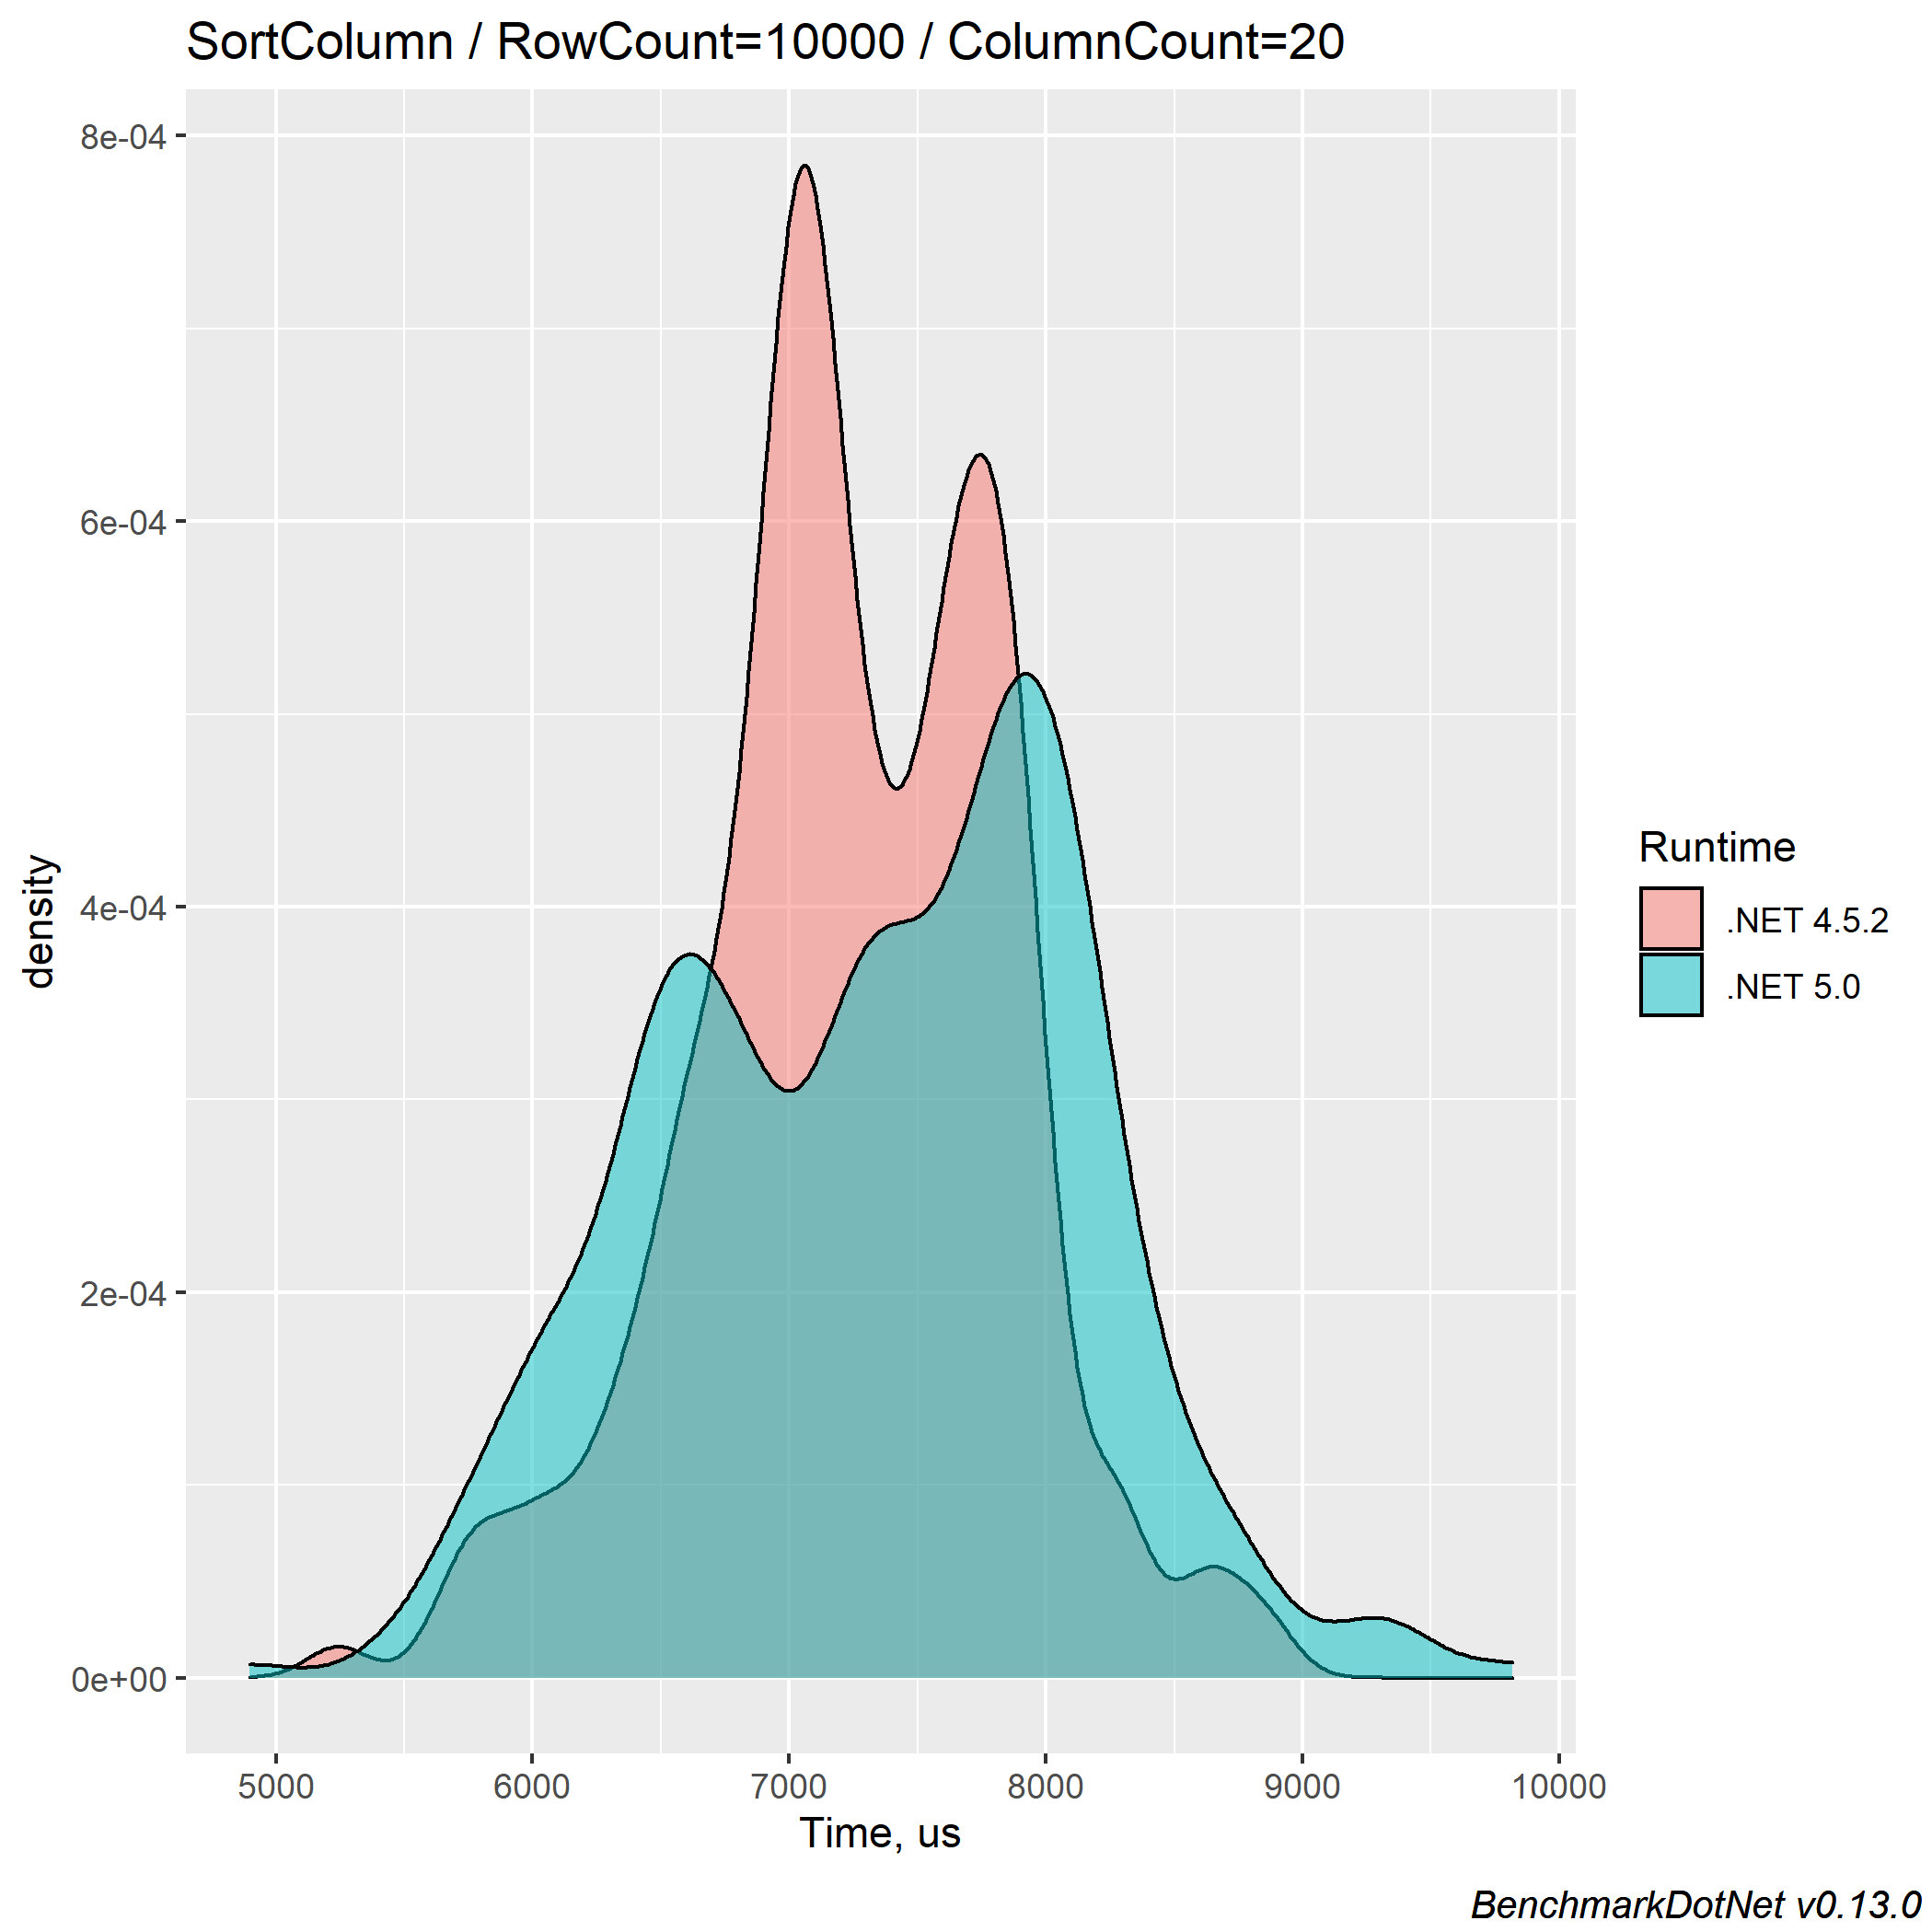
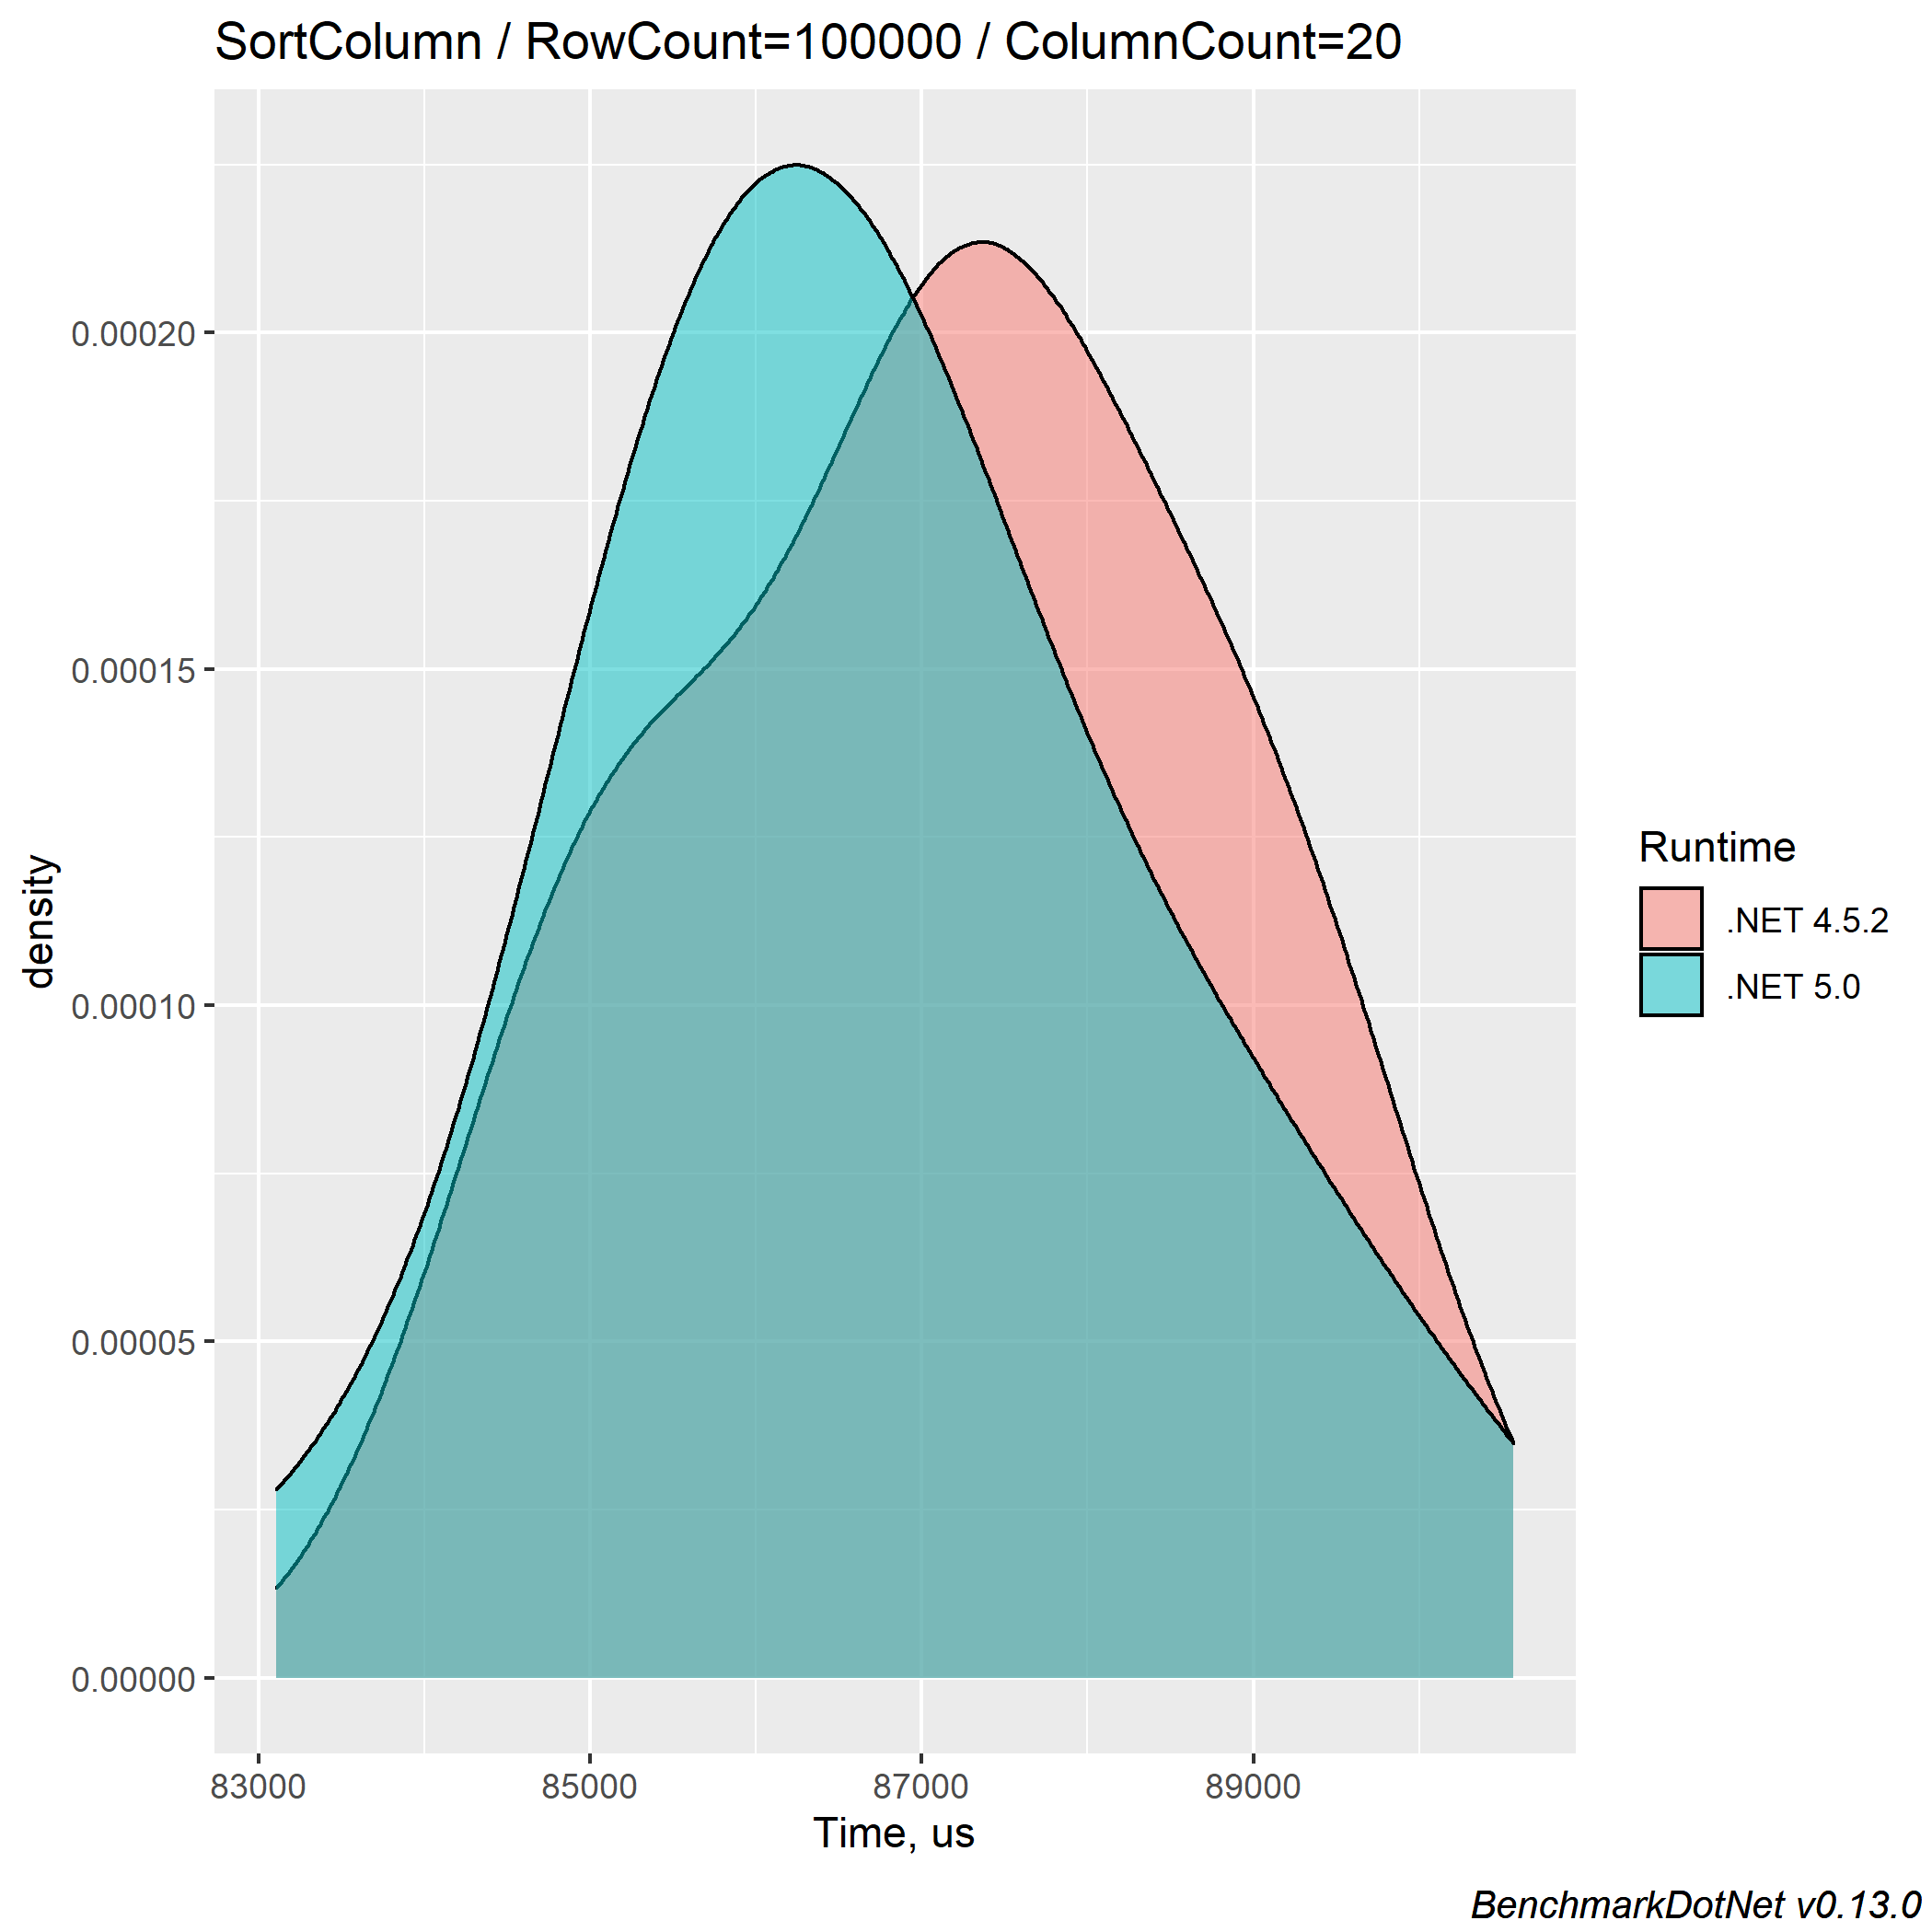
The density plots:
For 10000 rows:
For 100000 rows:
For 1000000 rows:
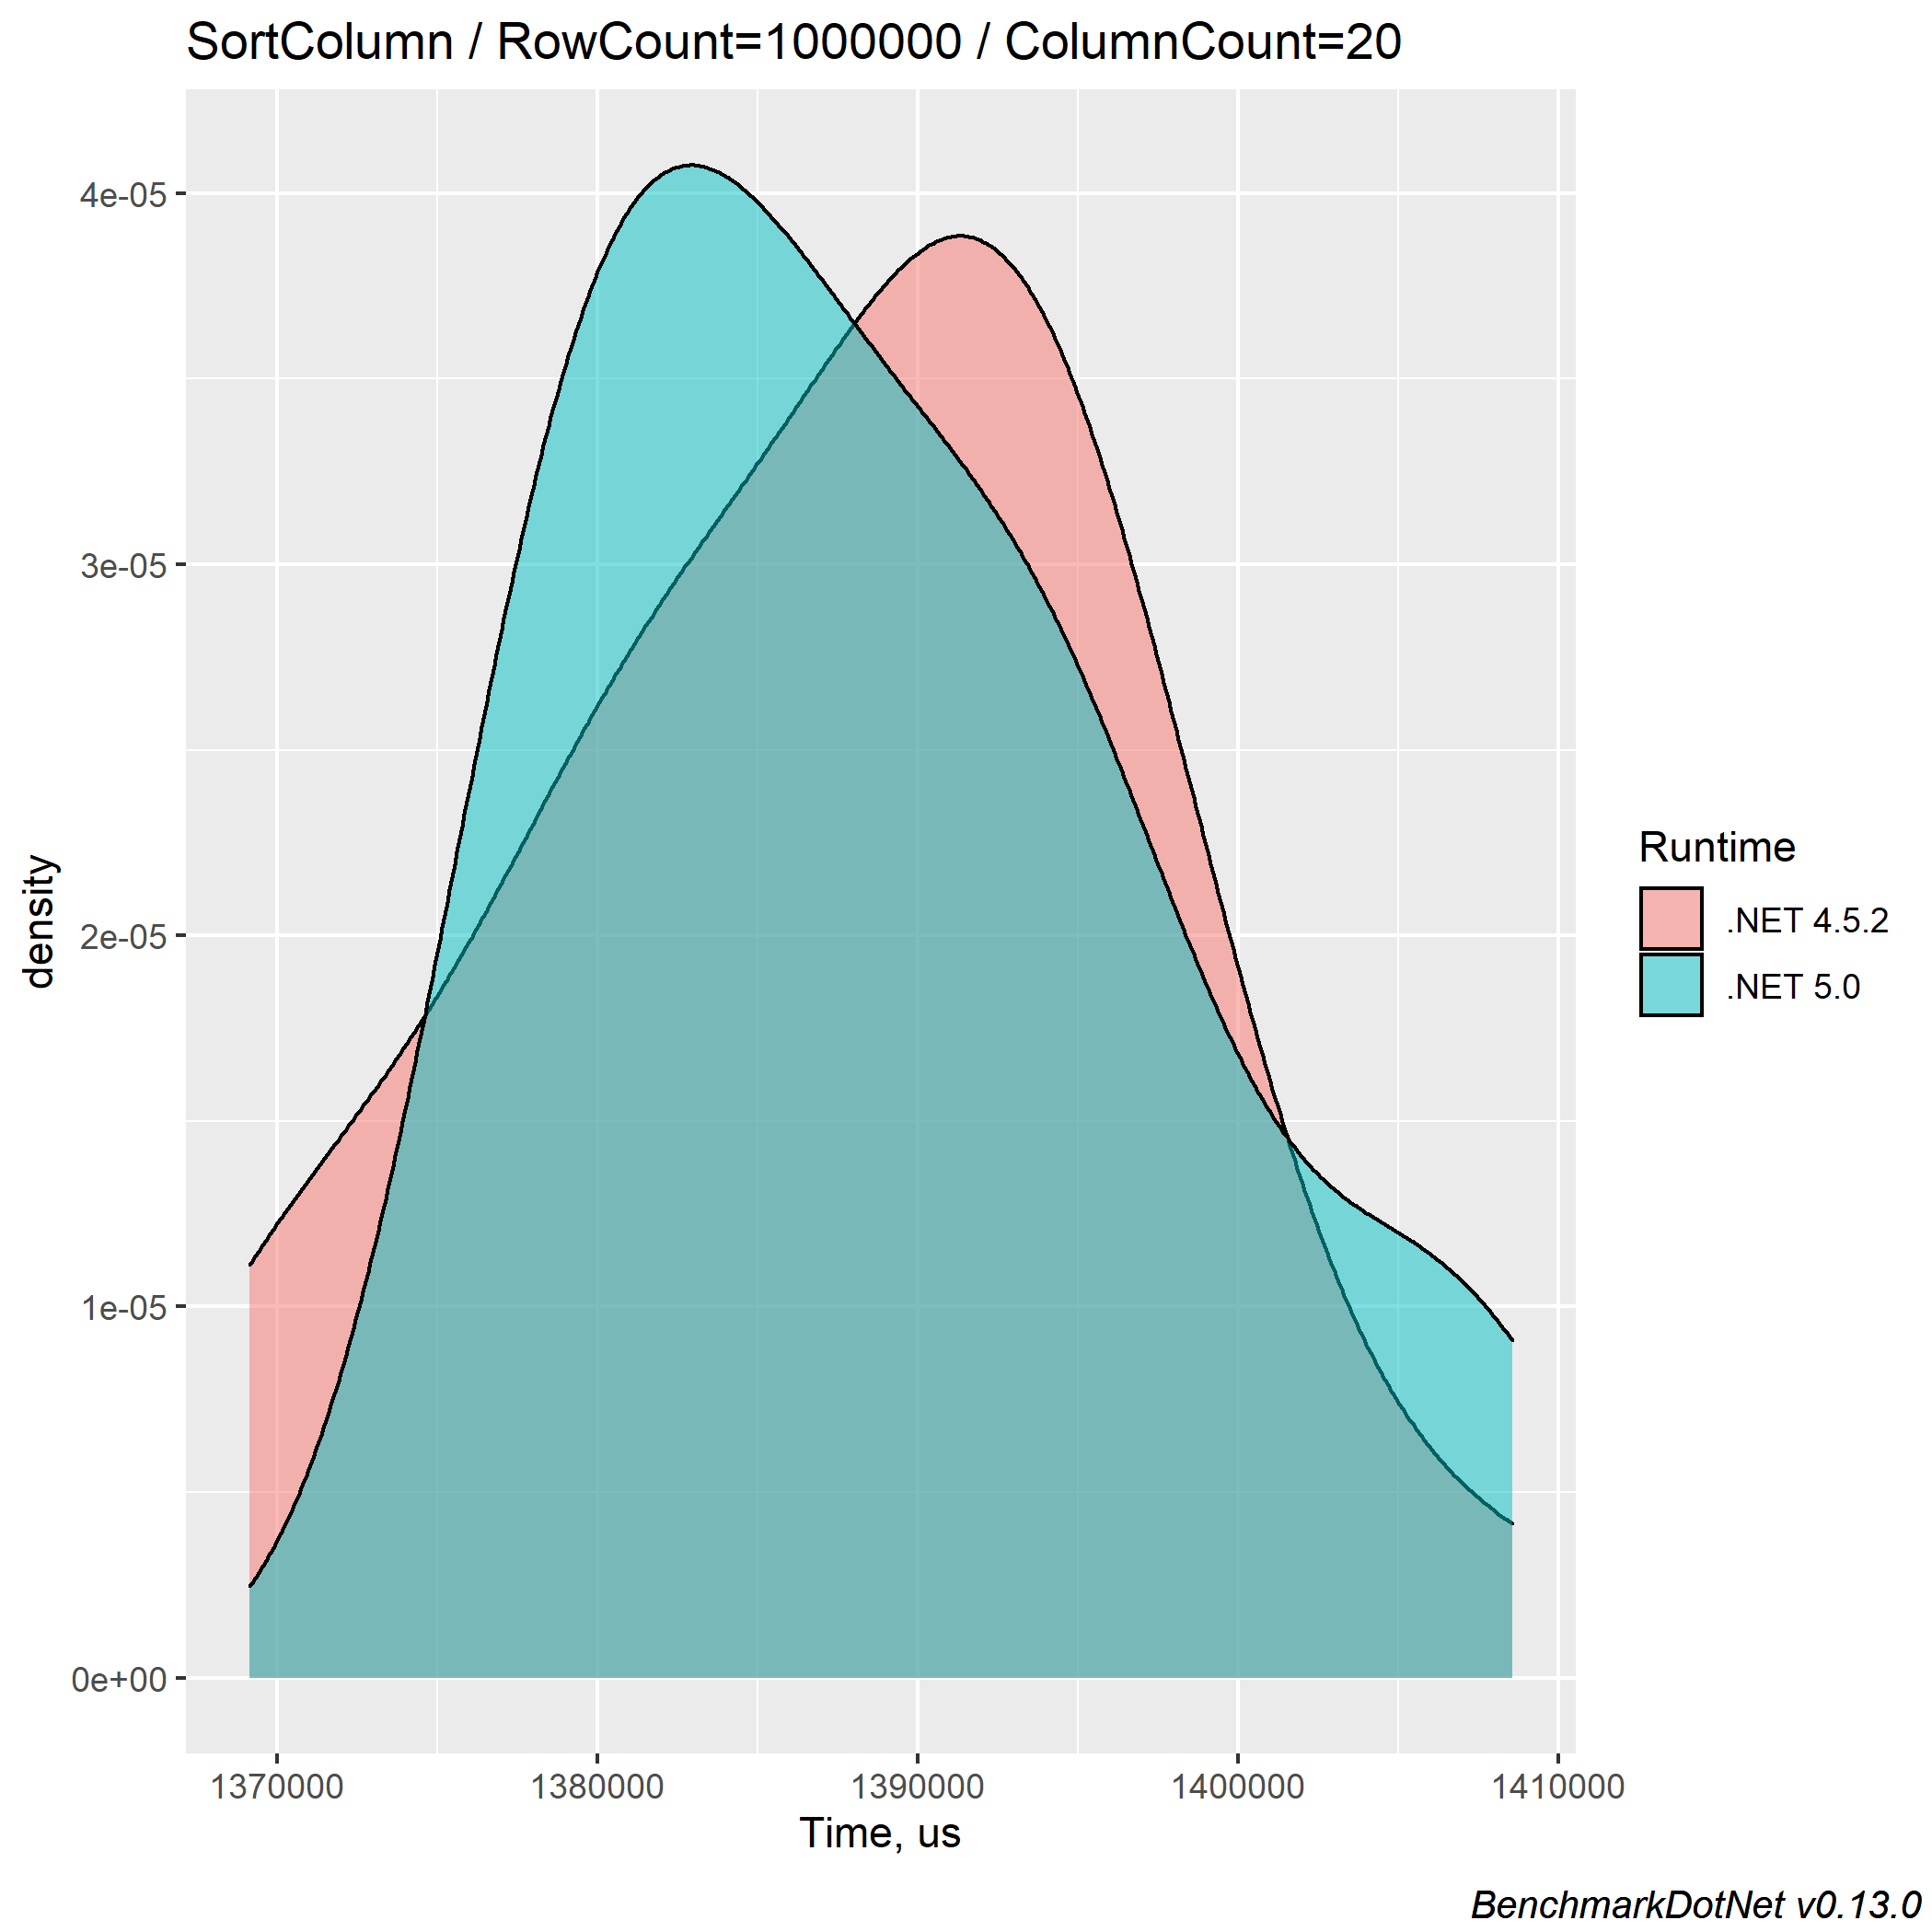
Most measurements for .NET 5 and the .NET Framework 4.5.2 versions are quite similar, but sometimes sorting for .NET 5 FlexGrid might be a little slower (the worst case is up to 5%). With the combination of painting performance gain, the end-user can see the sorted results by a similar time.
As in all previous tests, we can see a little memory allocation improvement, up to 1.3%, for .NET 5 FlexGrid.
Filtering a Column
Another common operation that end-users might perform is filtering. Filtering helps to show data that fit some criteria and hide others. Some criteria can be chosen for filtering. Here, we find the inner half of the data of some columns.
This additional operation is added to the IterationSetup stage to find the boundaries of the filtering range:
SortedSet<int> column0Values = new SortedSet<int>();

DataRowCollection rows = _data.DataTable.Rows;
foreach (DataRow row in rows)
{
    column0Values.Add((int)row.ItemArray[0]);
}

int column0ValuesCount = column0Values.Count;
int column0ValuesQuarterCount = column0ValuesCount / 4;
int column0ValuesThreeQuartersCount = column0ValuesQuarterCount * 3;

_condition1Parameter = column0Values.ElementAt(column0ValuesQuarterCount);
_condition2Parameter = column0Values.ElementAt(column0ValuesThreeQuartersCount);
The test method itself looks like this:
[Benchmark]
public void FilterColumn()
{
    _flexGrid.AllowFiltering = true;
    ConditionFilter conditionFilter = (_flexGrid.Cols[_flexGrid.Cols.Fixed].Filter as ColumnFilter).ConditionFilter;

    Condition condition1 = conditionFilter.Condition1;
    condition1.Operator = ConditionOperator.GreaterThan;
    condition1.Parameter = _condition1Parameter;

    Condition condition2 = conditionFilter.Condition2;
    condition2.Operator = ConditionOperator.LessThan;
    condition2.Parameter = _condition2Parameter;

    _flexGrid.ApplyFilters();
}
The summary table:
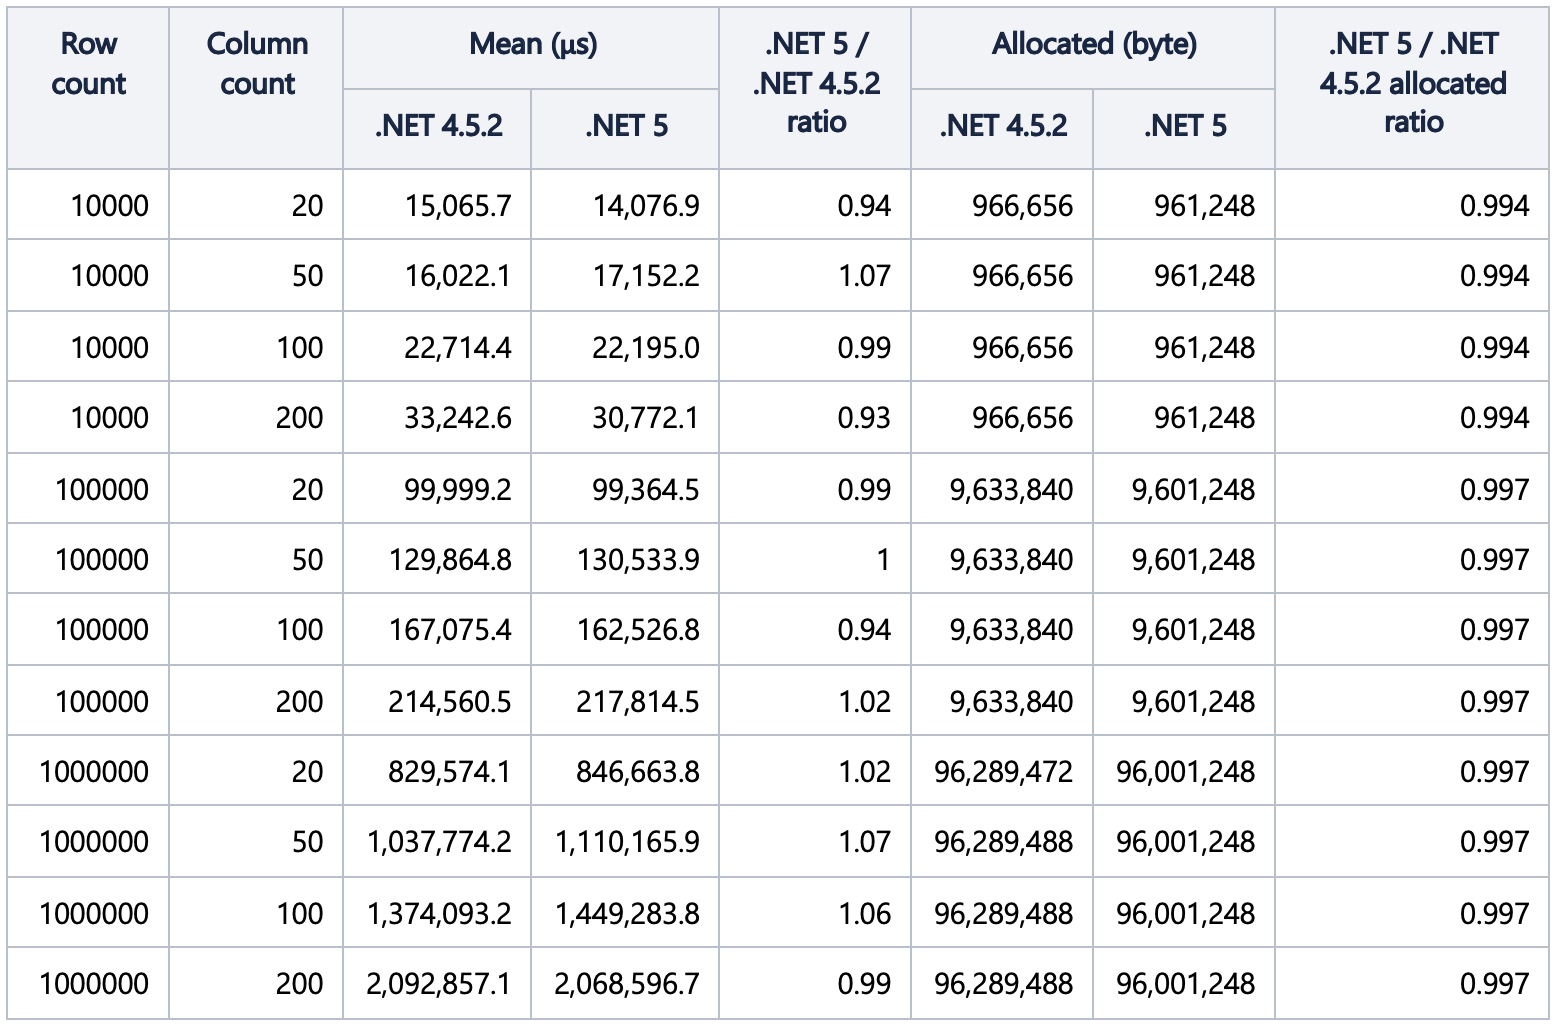
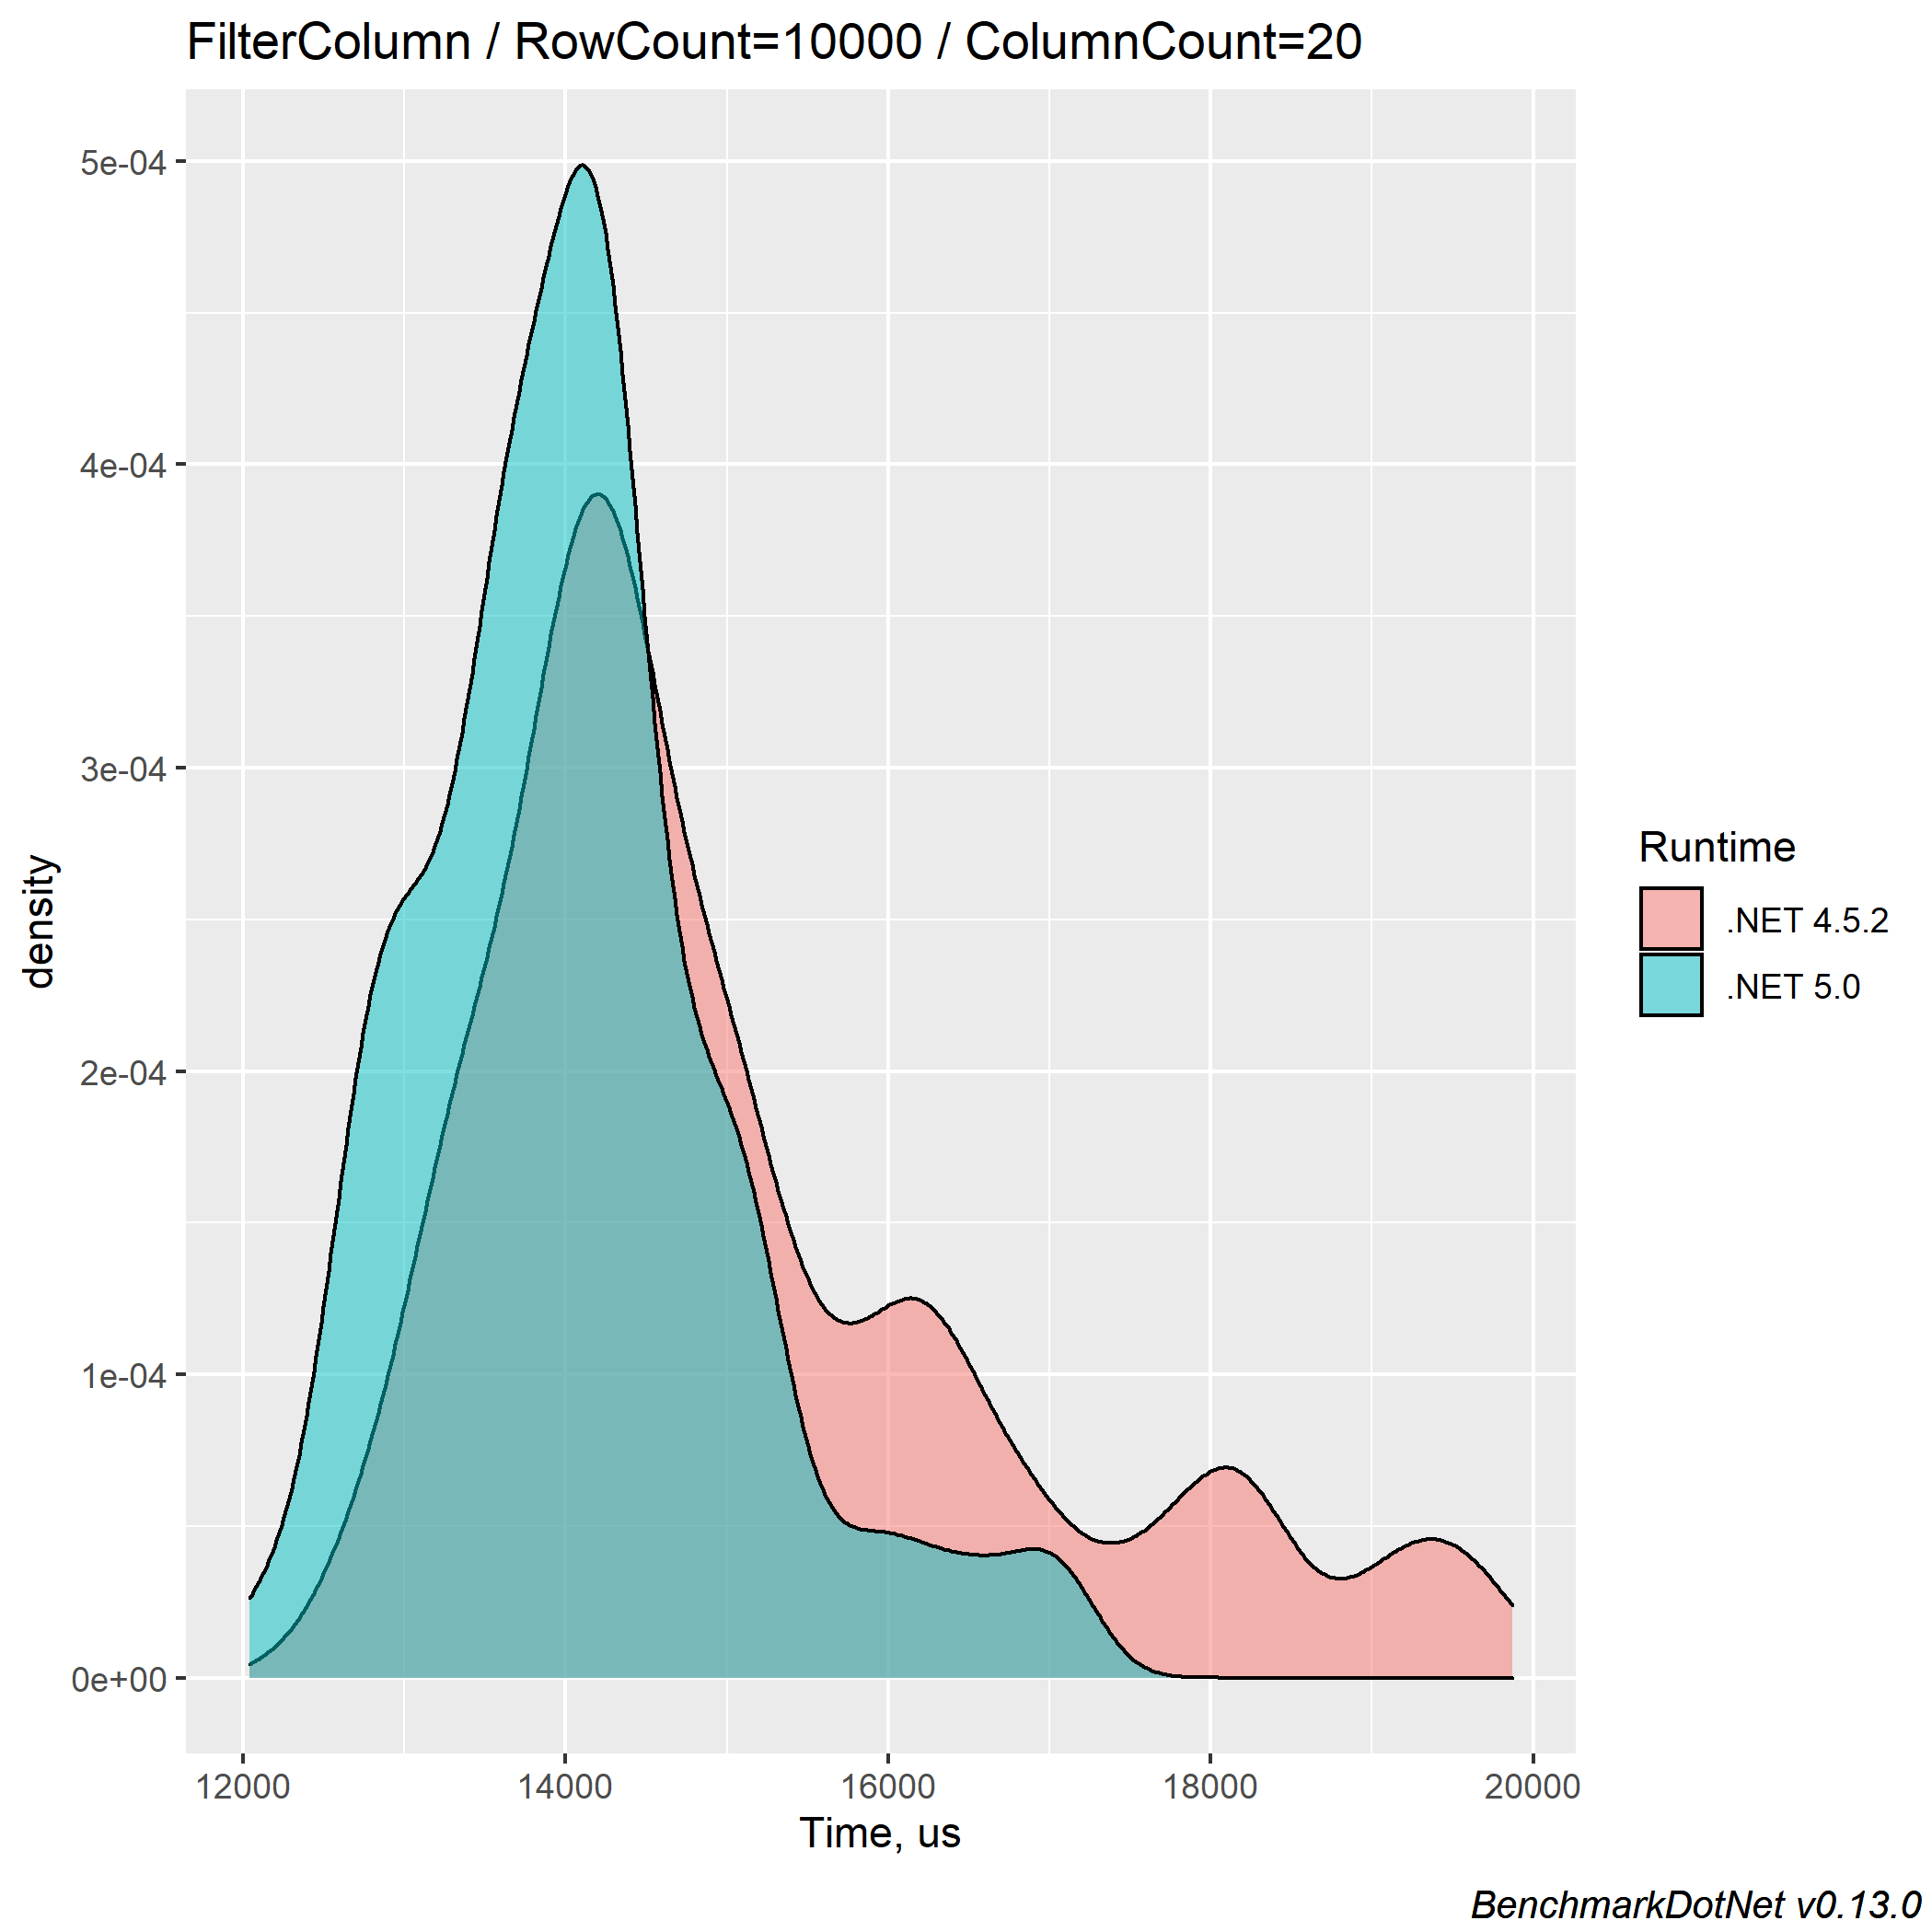
The density plots:
For 10000 rows:
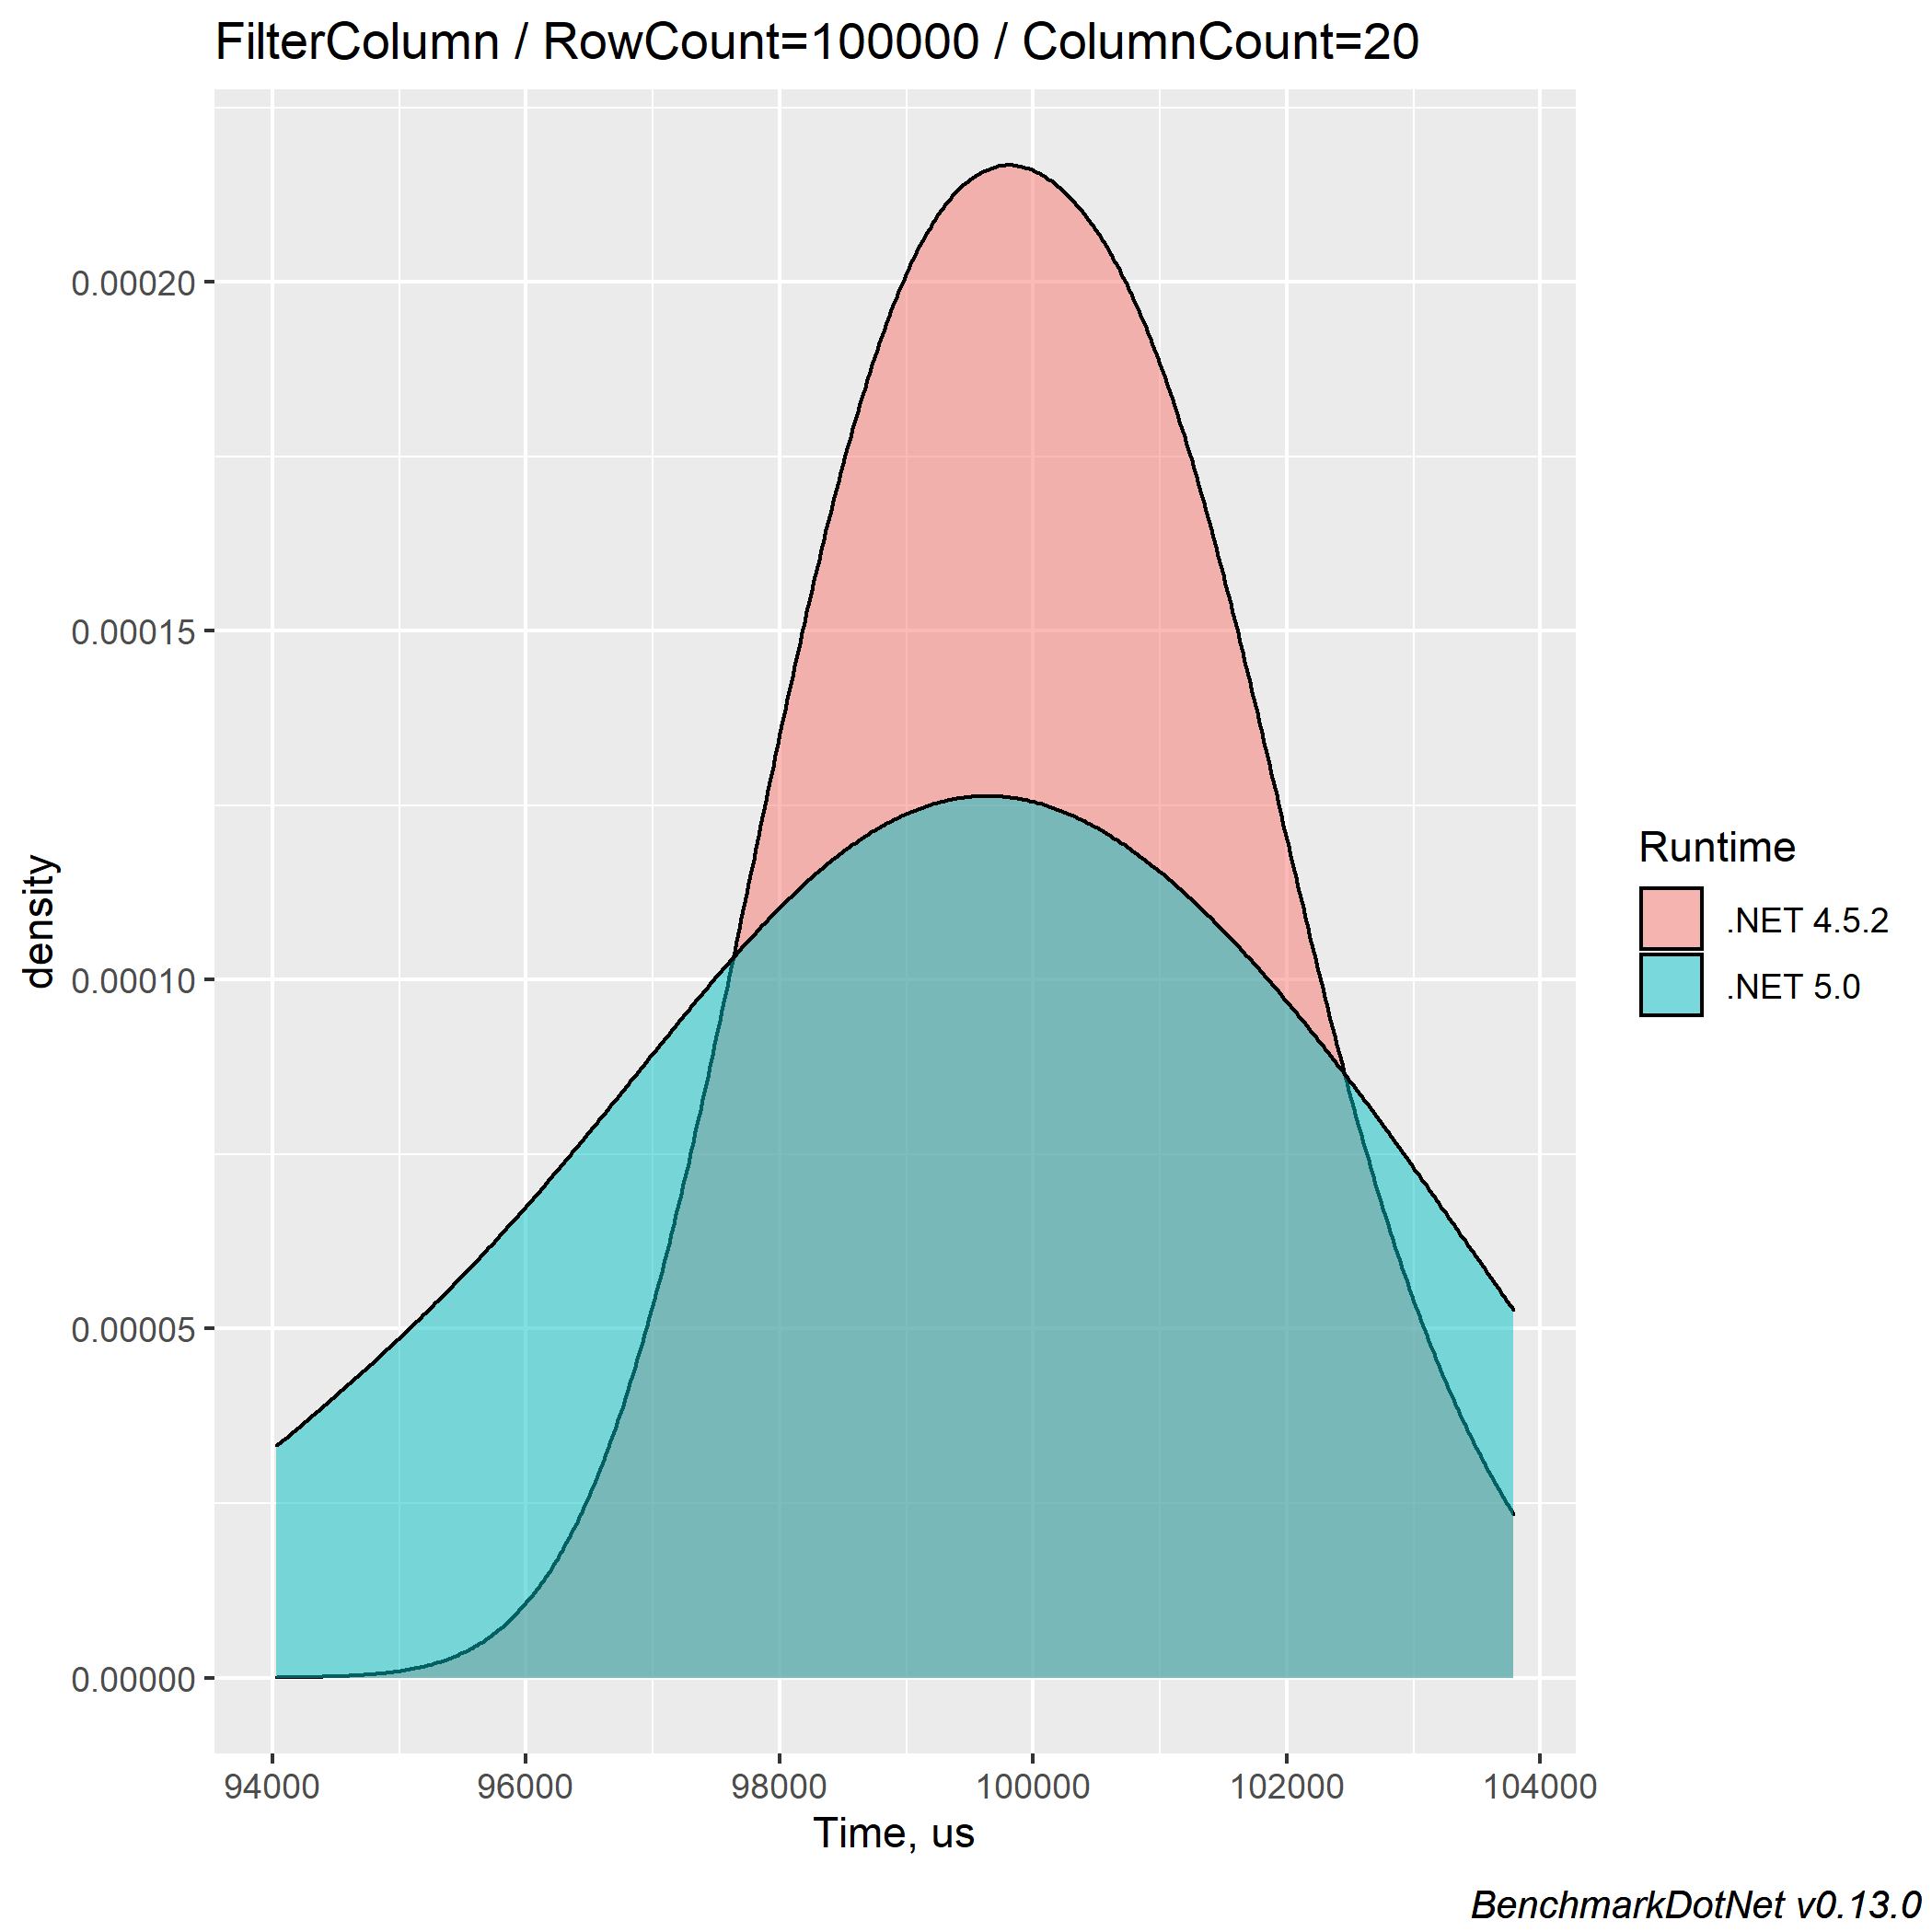
For 100000 rows:
For 1000000 rows:
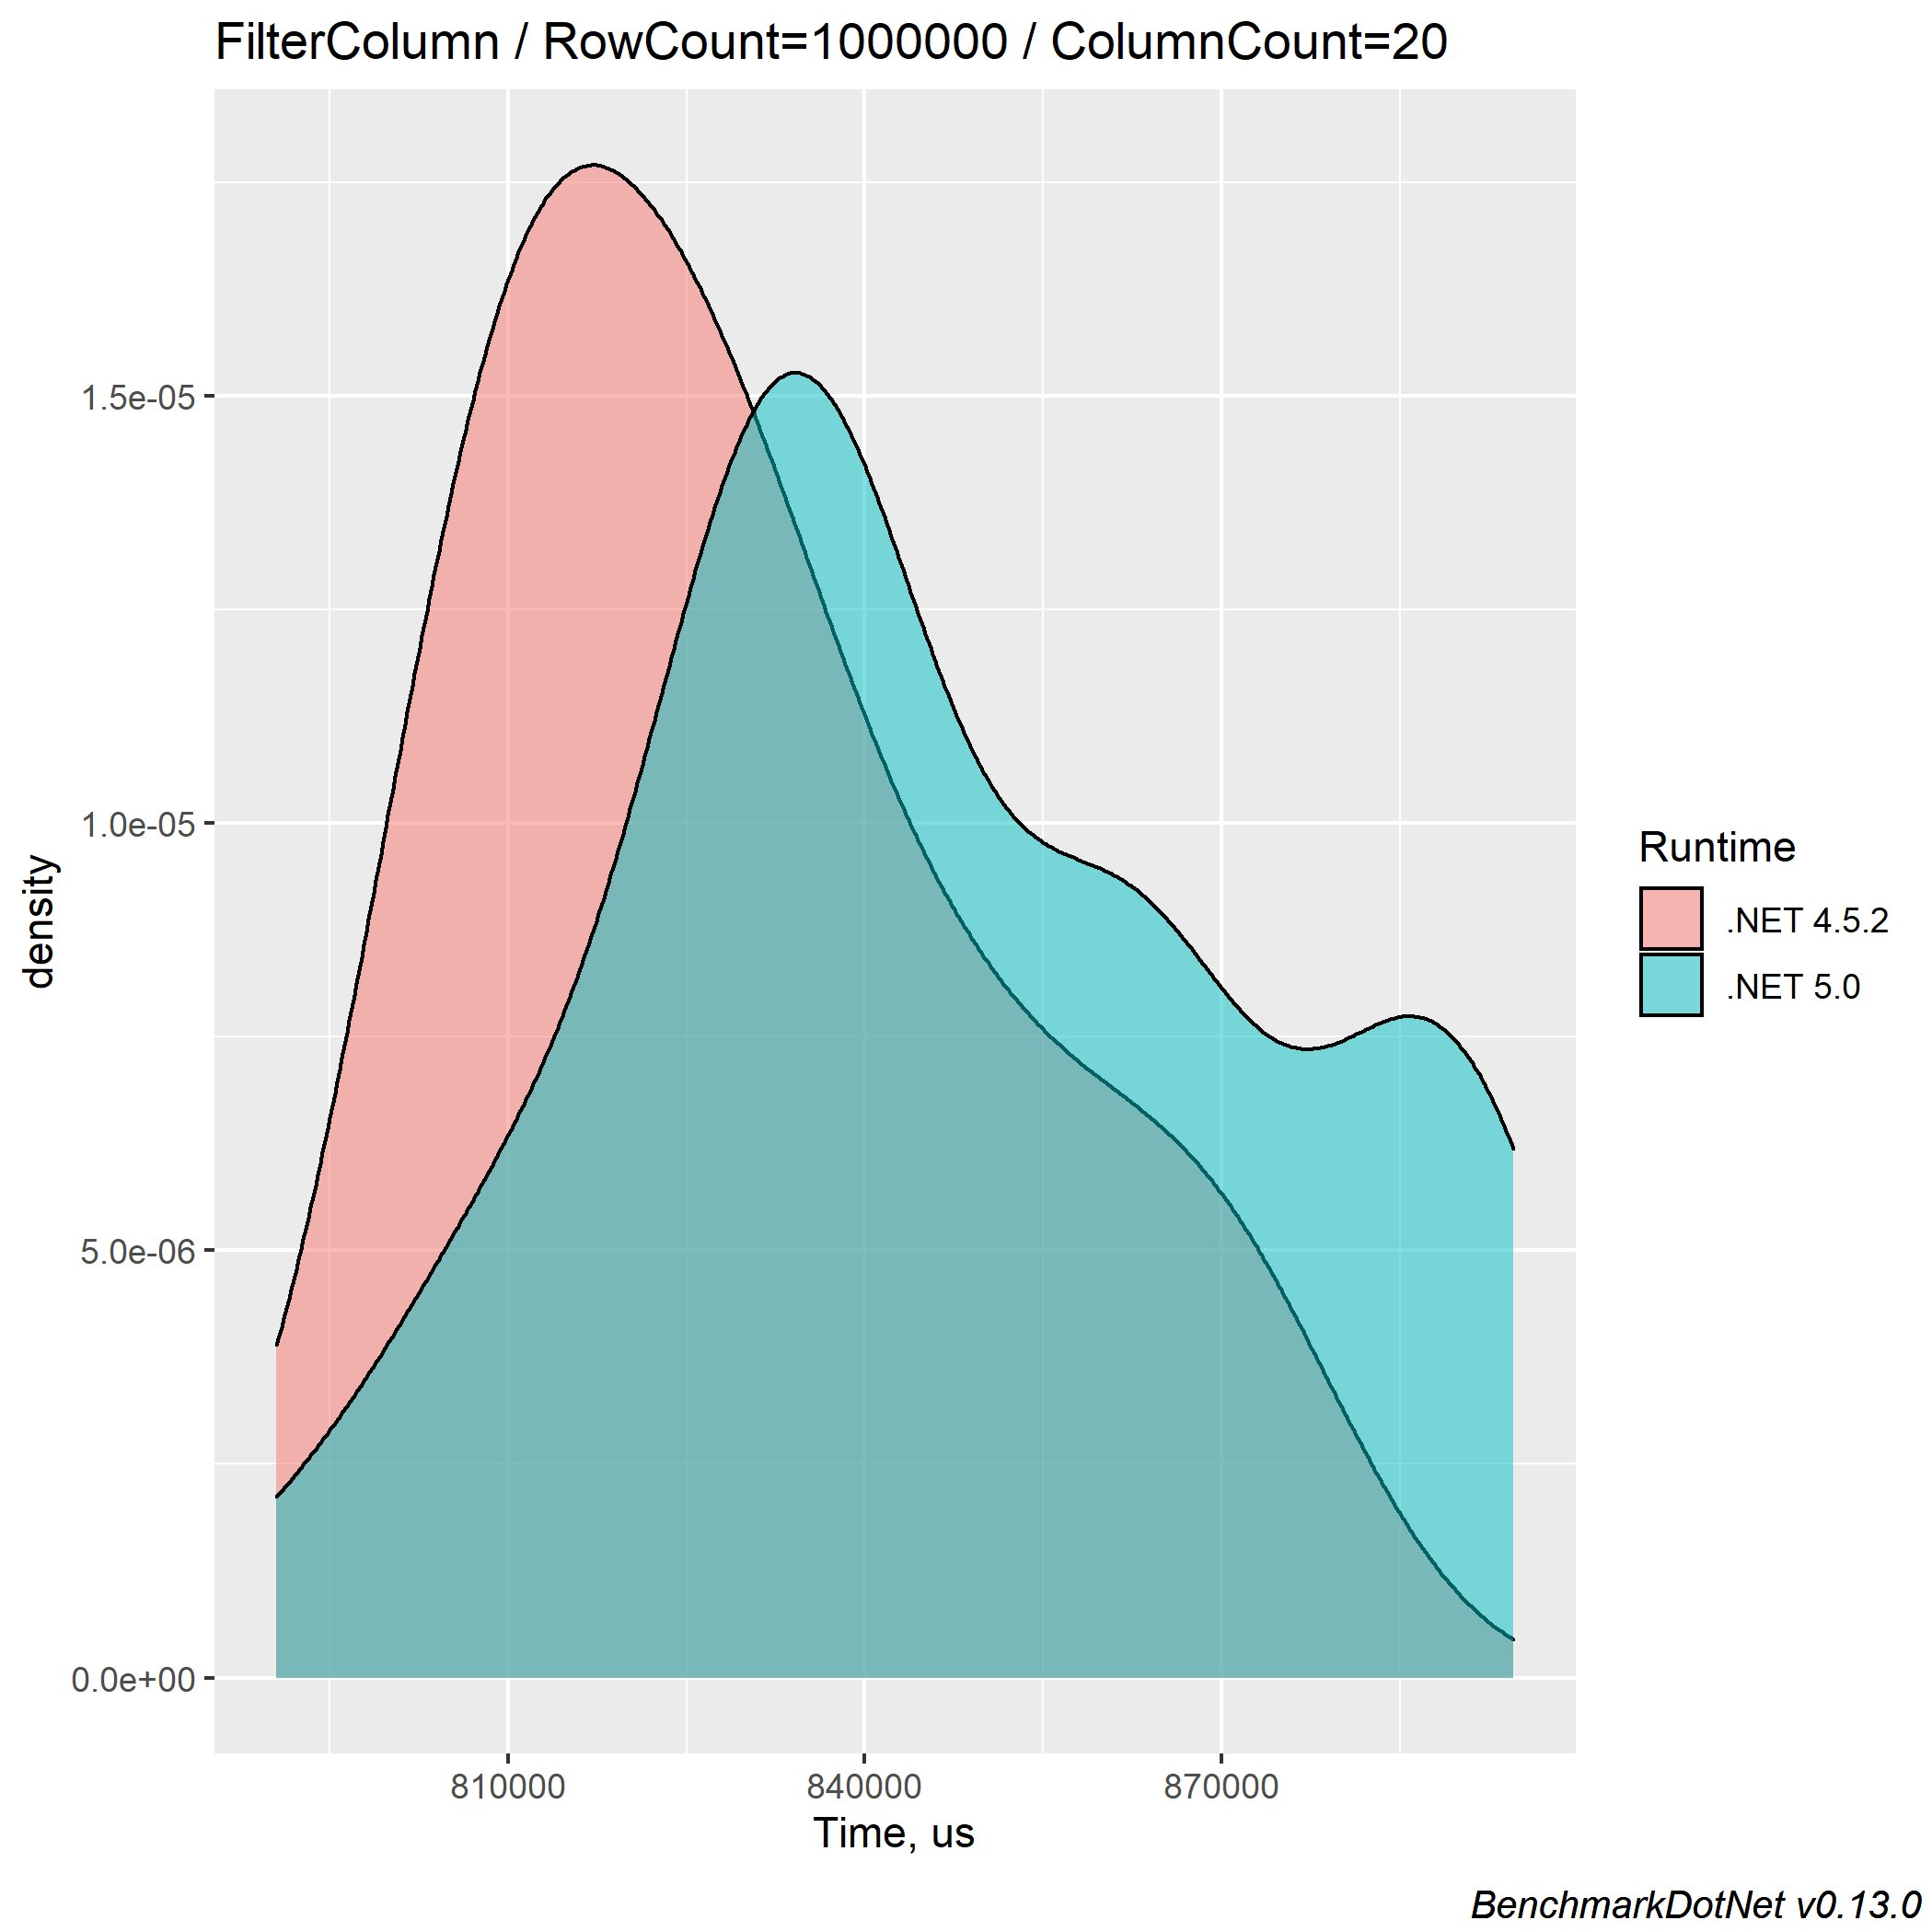
Here we can see that, again, there isn't an absolute leader. The painting of filtered results might compensate for the cases where performance improvements are absent, and the users can see the results at the same time.
Again, the the .NET 5 FlexGrid requires less memory for filtering operation, up to 1.6%.
Grouping By Column
Grouping allows end-users to analyze data on a much smaller sample. This is another common operation.
Since we want to create groups of different sizes, grouping is performed on the column with DataMap, which contains some repetitive data:
[Benchmark]
public void GroupColumn()
{
    _flexGrid.GroupDescriptions = new List<GroupDescription>()
    {
        new GroupDescription(_flexGrid.Cols[_firstDataMapColumnIndex].Name, ListSortDirection.Ascending)
    };
}
The summary table:
The density plots:
For 10000 rows:
For 100000 rows:
For 1000000 rows:
Grouping results are quite similar to sorting. Sometimes, .NET 5 FlexGrid is a bit faster than 4.5.2, sometimes the other way around.
As always, for previous tests, we can see grouping within .NET 5 allocates less memory than .NET 4.5.2. The best case is up to 1.6%.
Auto-Sizing Columns
Sometimes the end-user needs to align the sizes of all FlexGrid columns to fit the displayed data. This can be done with the AutoSizeCols method of FlexGrid.
The operation is very heavy and requires measuring data in each cell of the grid. So, for such heavy test we decrease the maximum amount of row count this way:
[Params(10000, 100000)]
public override int RowCount { get; set; }
The benchmark method looks like this:
[Benchmark]
public void AutoSizeColumns()
{
    _flexGrid.AutoSizeCols();
}
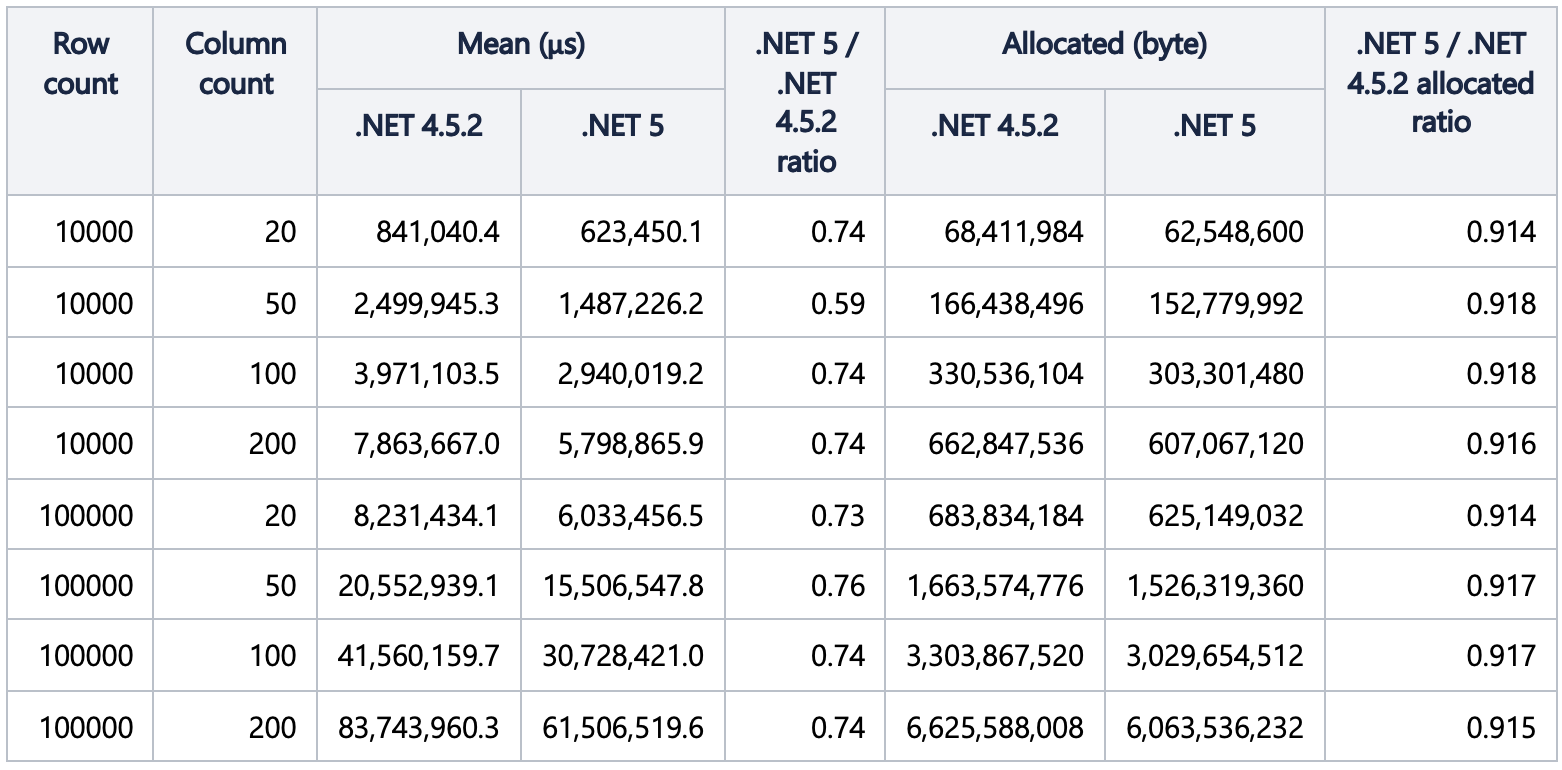
The summary table:
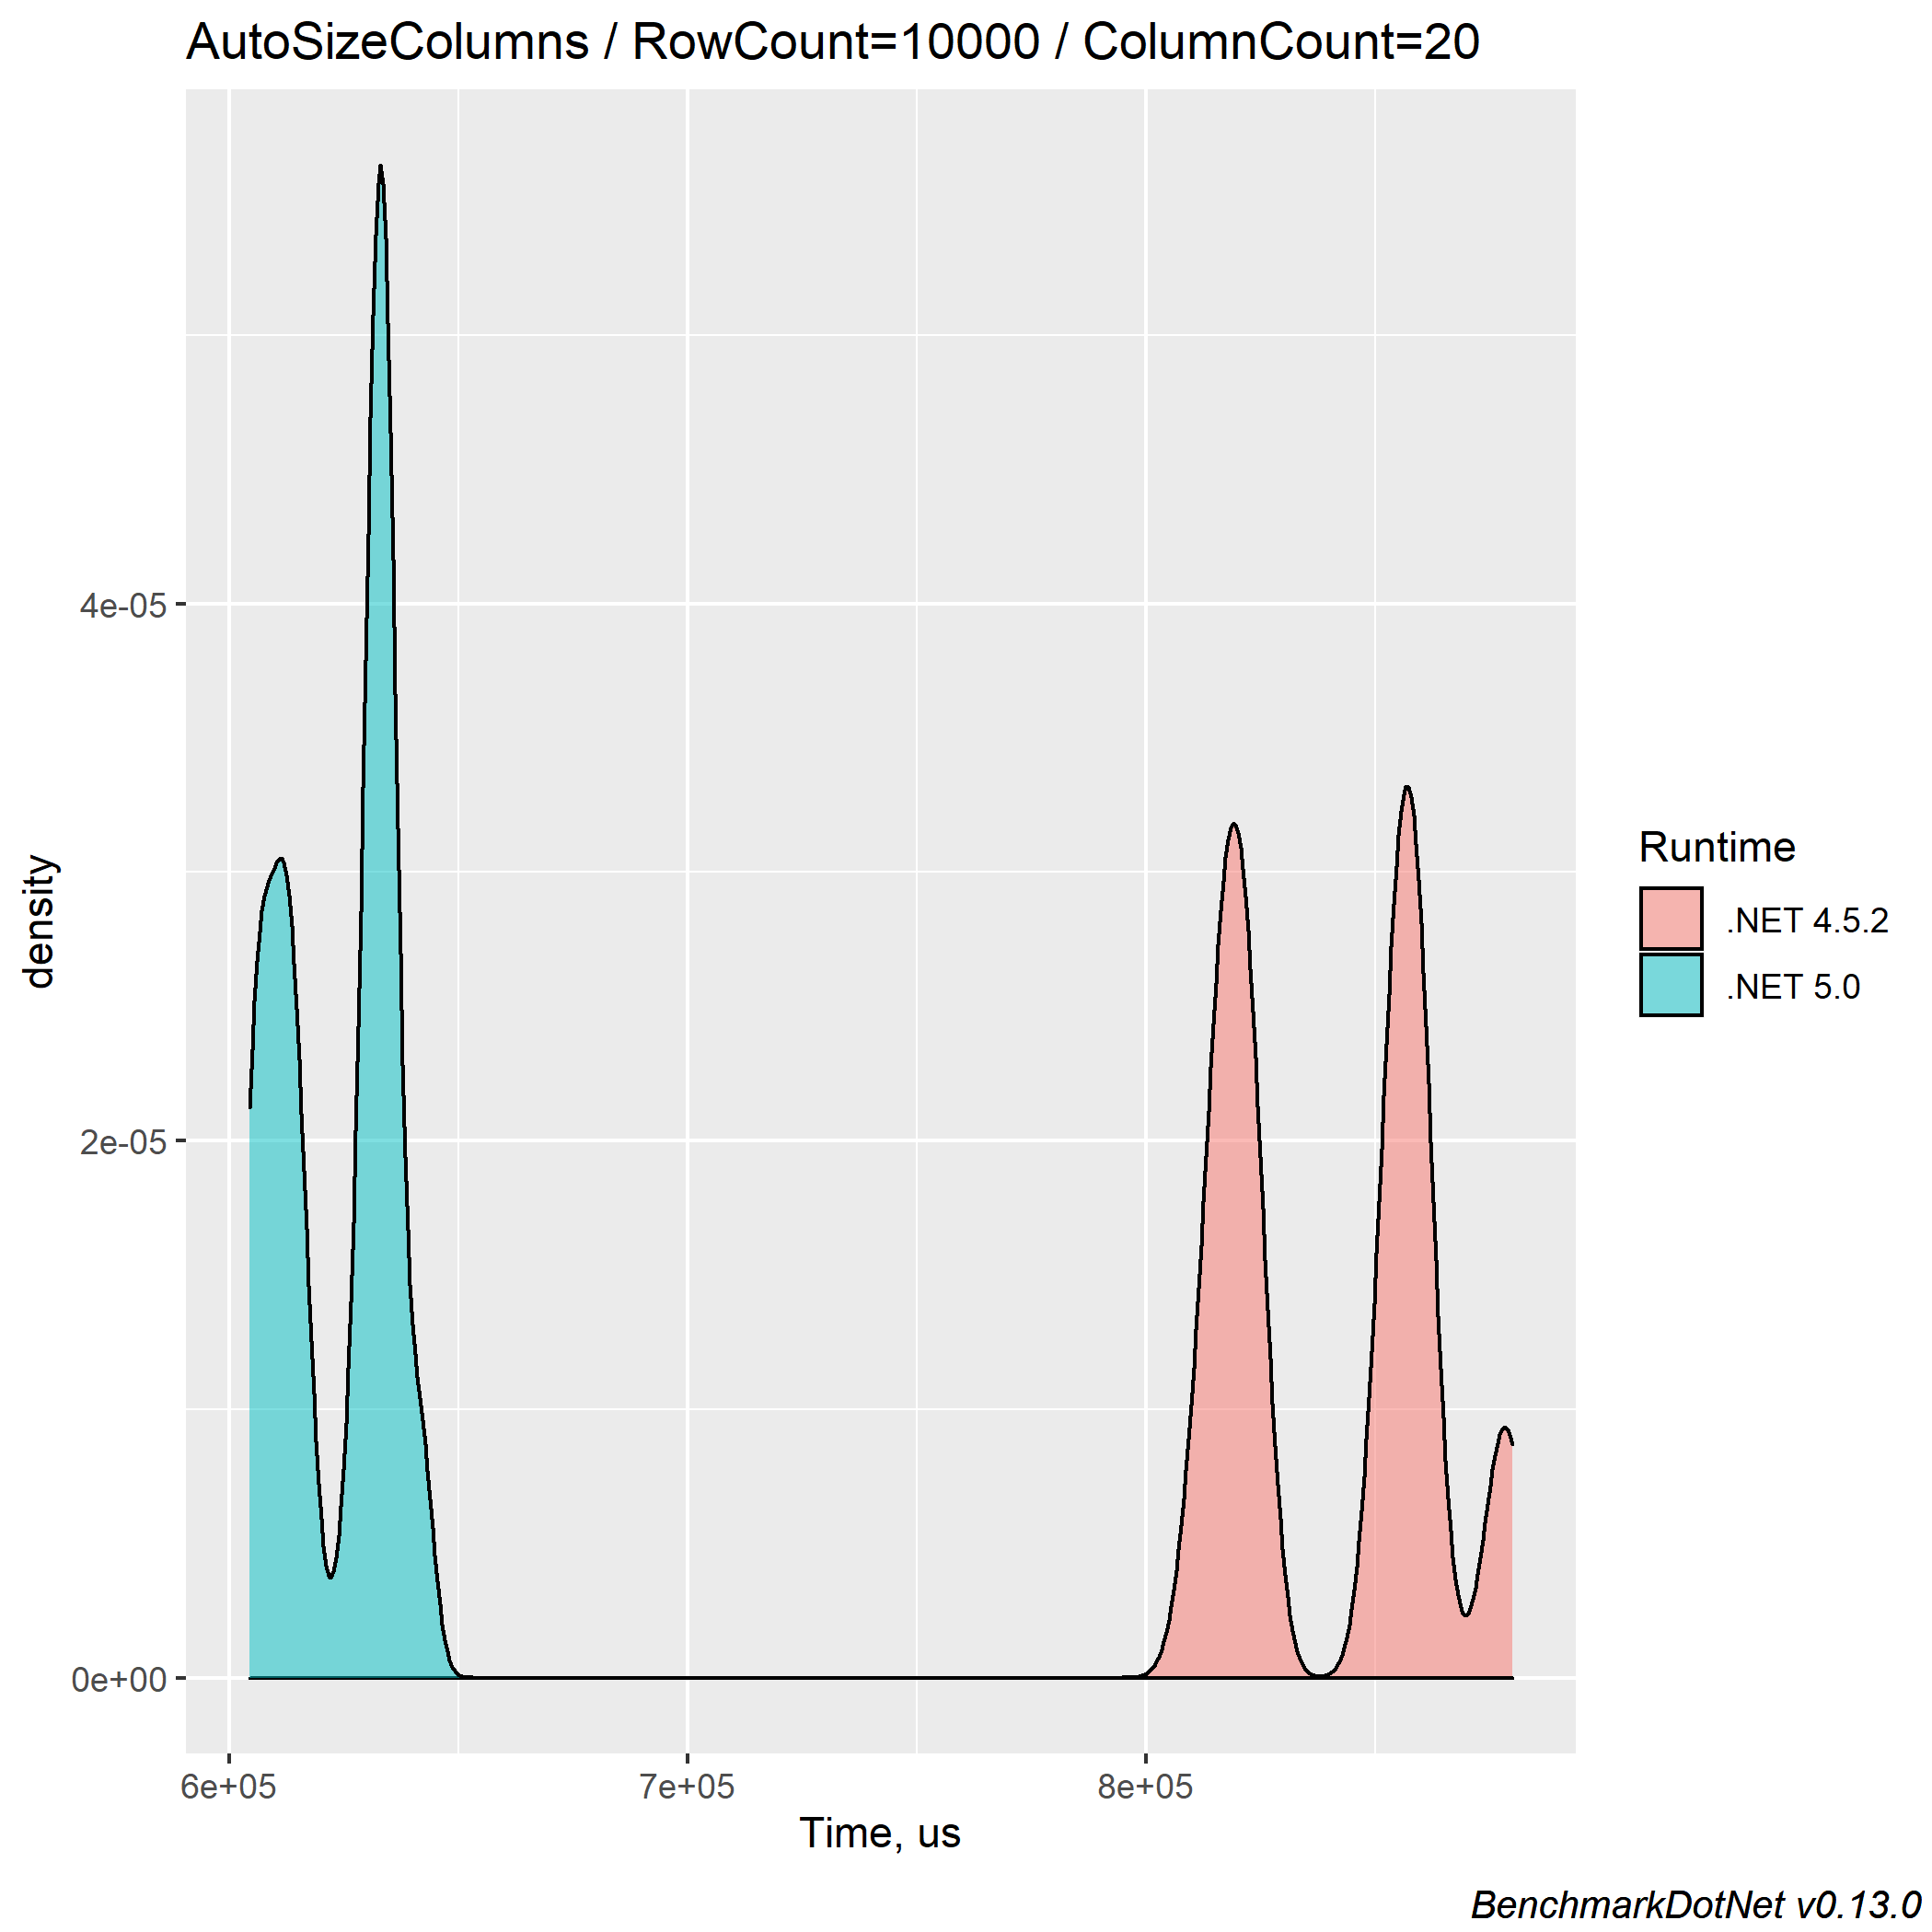
The density plots:
For 10000 rows:
For 100000 rows:
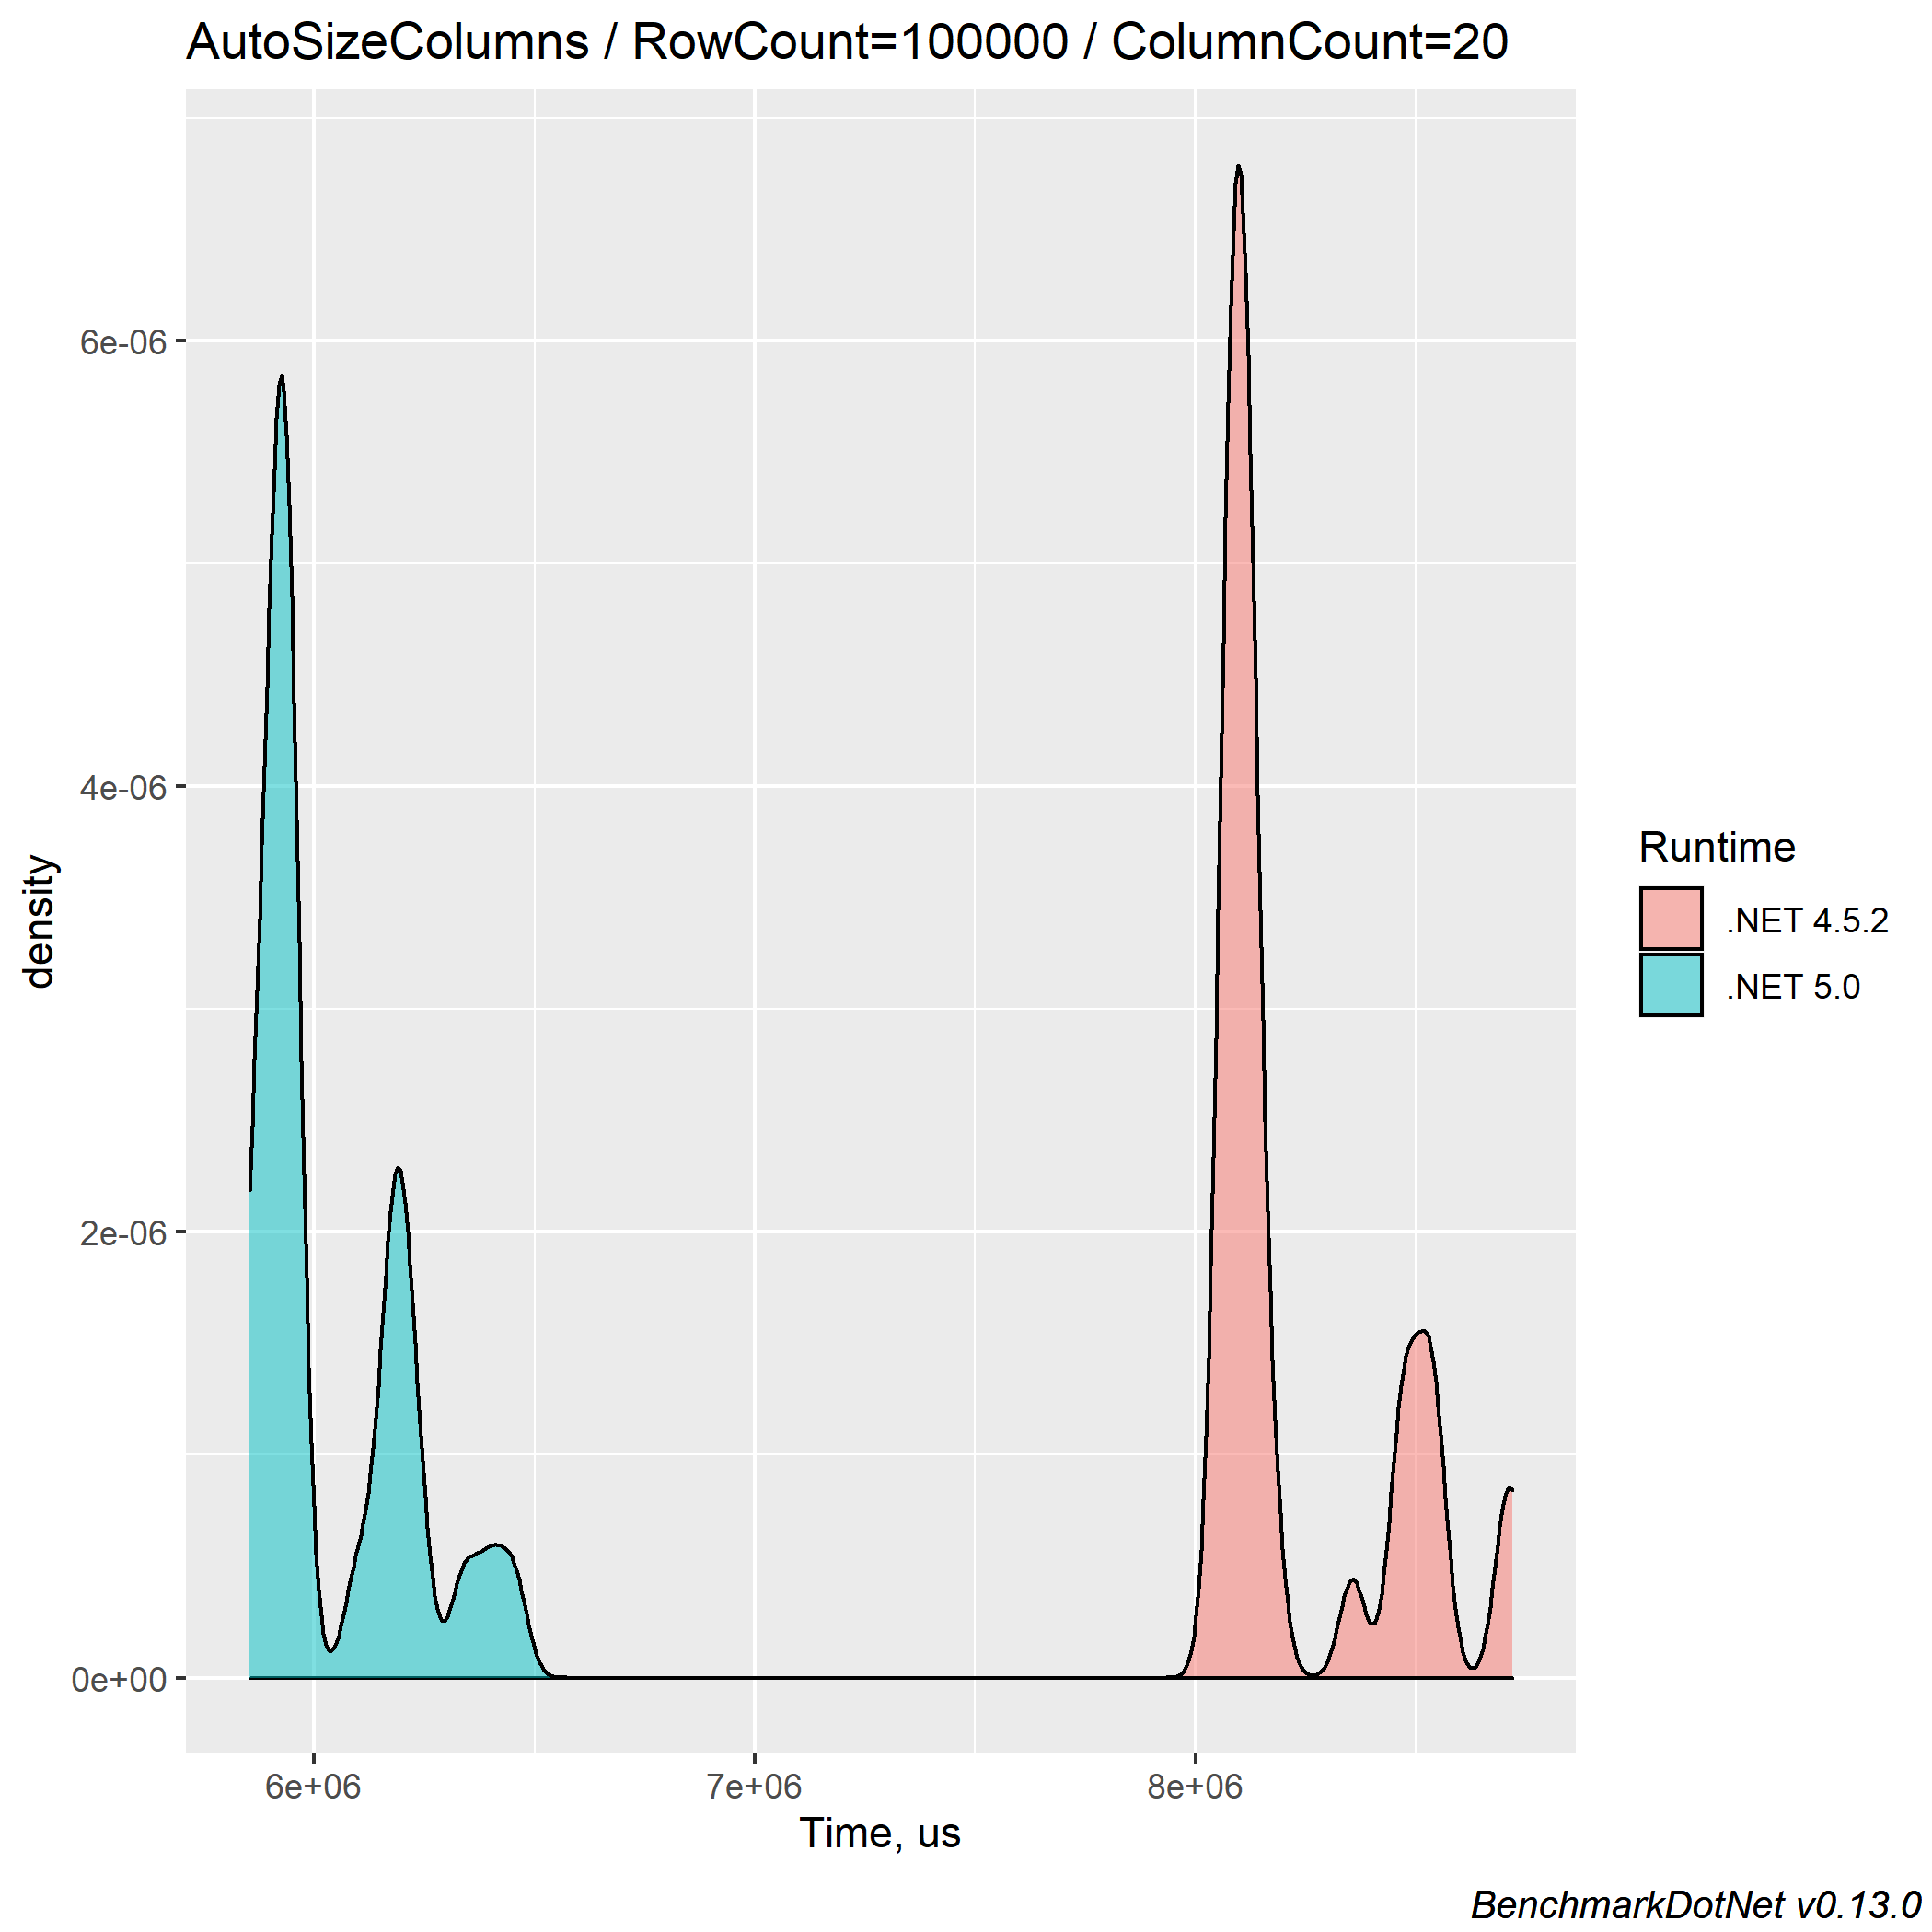
As we can see here, there is a significant performance gain for .NET 5 FlexGrid, up to 31%.
Also, the .NET 5 version allocates up to 8.6% less memory than .NET 4.5.2.
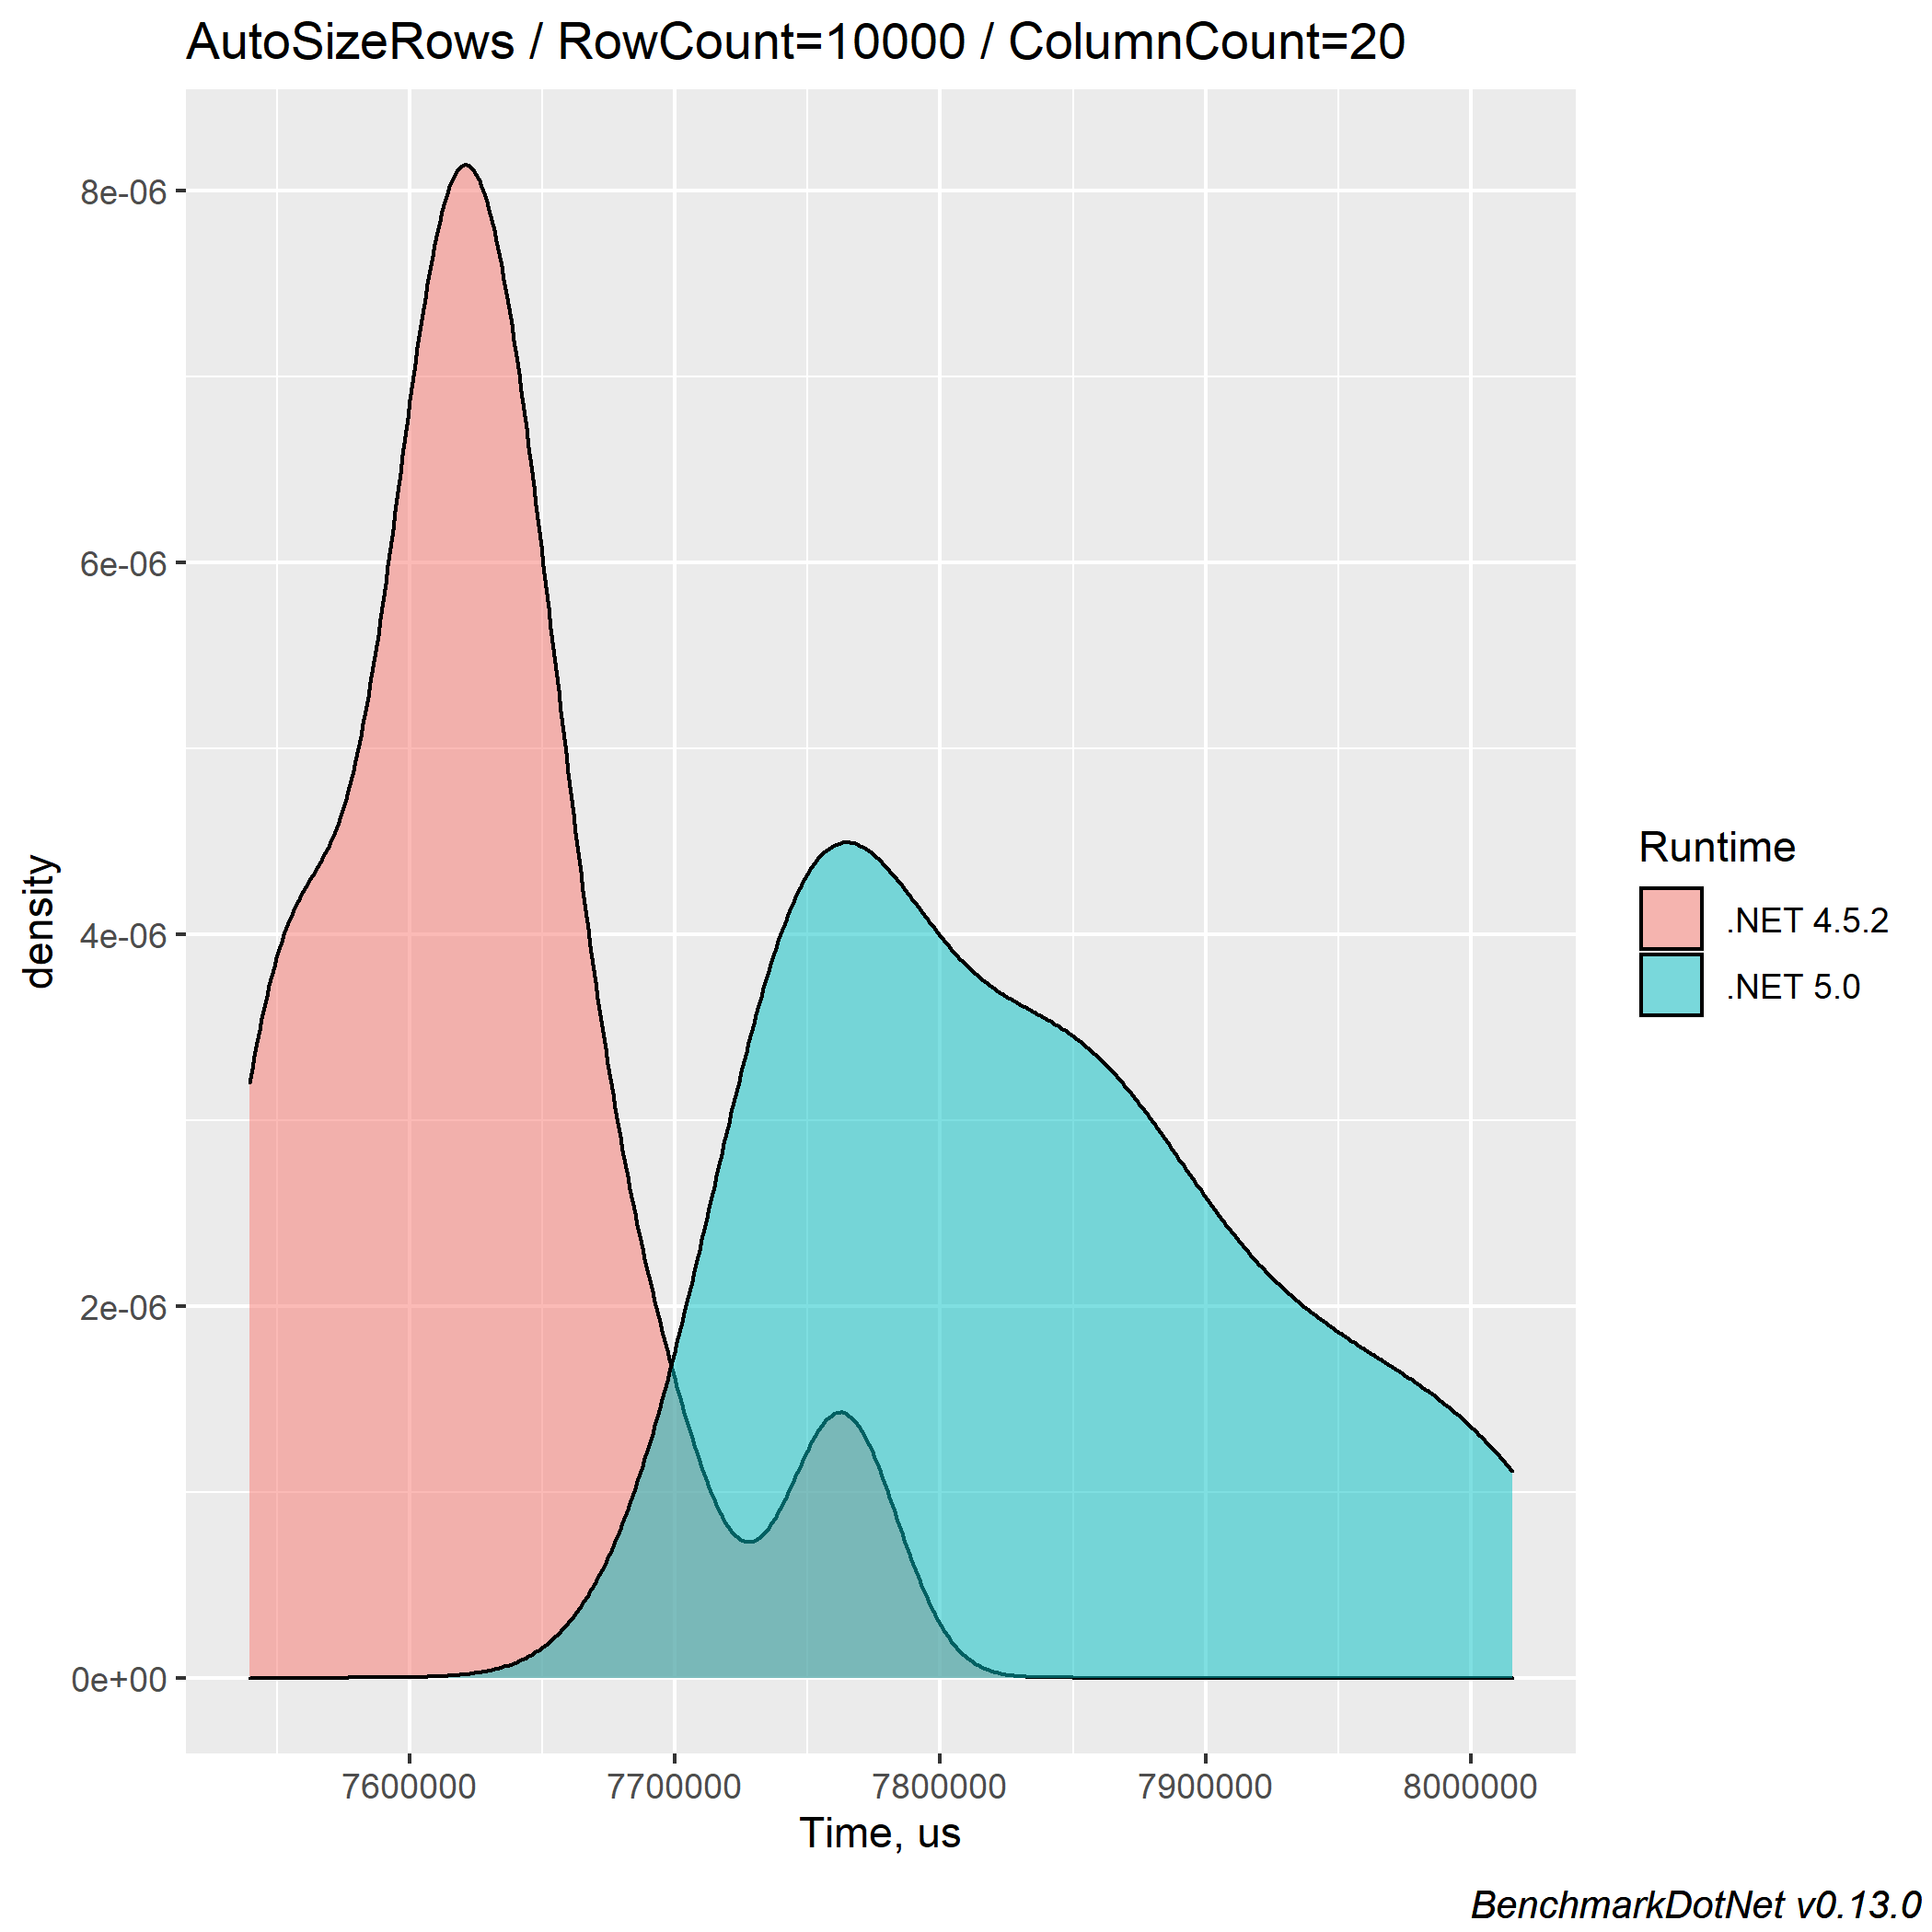
Auto-Sizing Rows
The other way to fit all the displayed data in their cell is FlexGrid’s AutoSizeRows method.
The data is a single-line value most of the time, but there might be some long string values or even sentences and paragraphs. For such cases, we need to setup word wrapping to allow the data to fit the cell:
_flexGrid.Styles.Normal.WordWrap = true;
Again, we reduce the maximum amount of rows the same way as AutoSizeColumns test:
[Params(10000, 100000)]
public override int RowCount { get; set; }
The benchmark method itself:
[Benchmark]
public void AutoSizeRows()
{
    _flexGrid.AutoSizeRows();
}
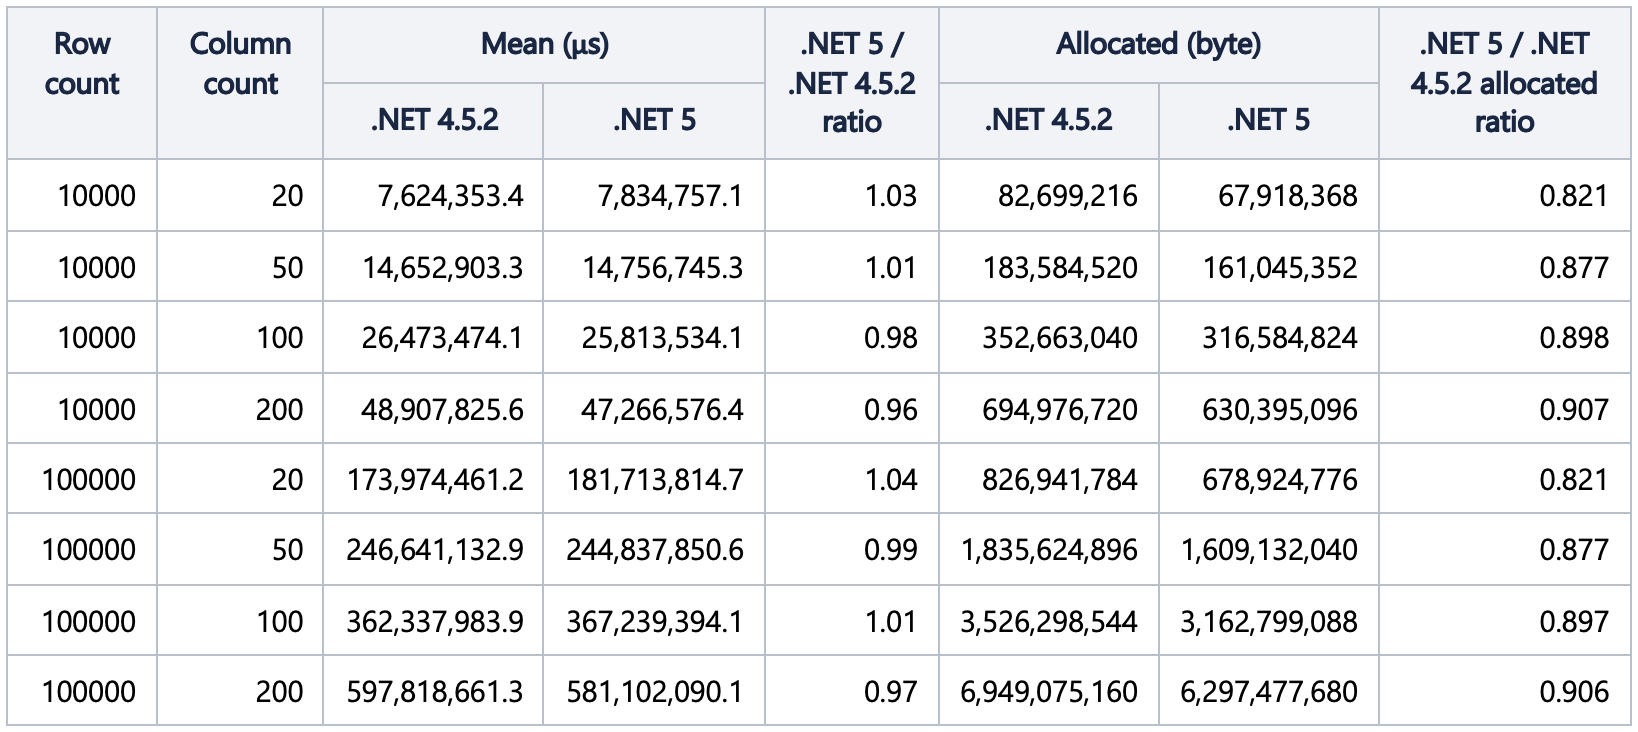
The summary table:
The density plots:
For 10000 rows:
For 100000 rows:
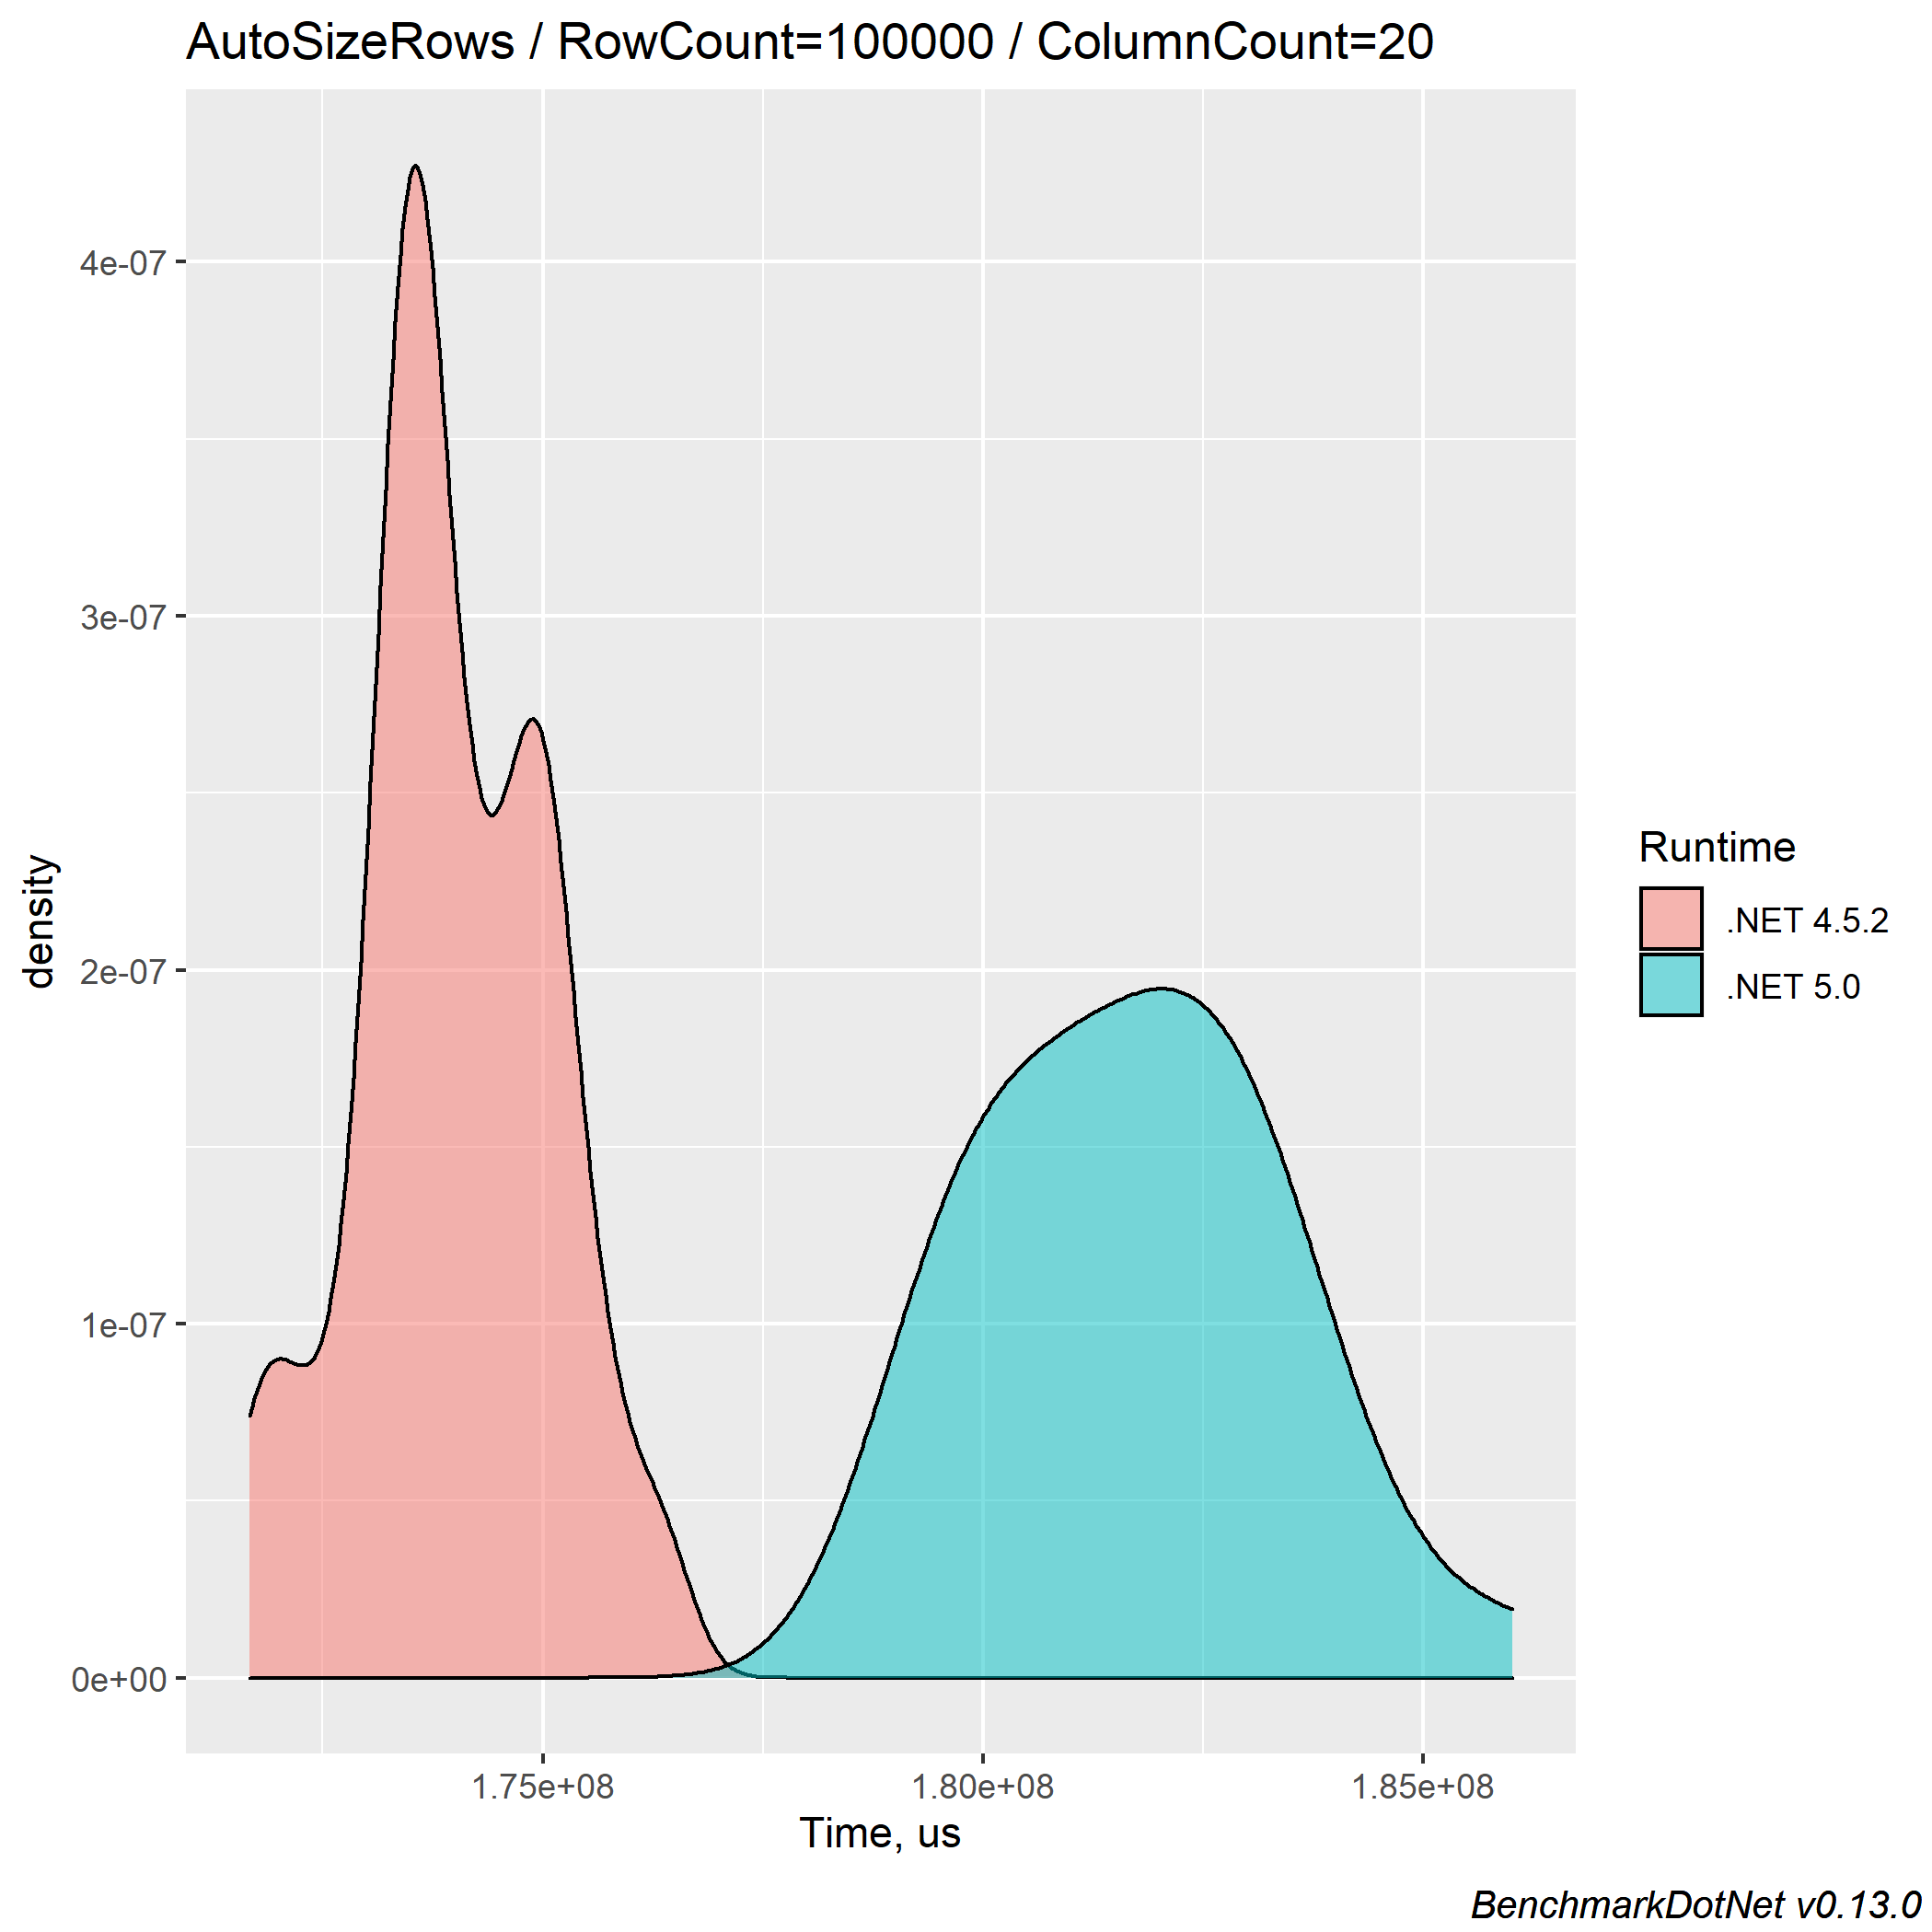
This time the performance doesn't differ by much value and we have quite similar results.
And as for all previous tests there is up to 17.9% less memory required for .NET 5 FlexGrid row auto sizing.
In this blog post, we measured some common operations which end-users might perform with the FlexGrid for .NET 5 and .NET Framework 4.5.2.
For all tested operations of any data size, .NET 5 FlexGrid requires less memory than the .NET 4.5.2 version. This means that writing (or porting) your application on top of .NET 5 allows other apps on your PC to use such excess of memory for their processes.
We found significant performance improvements for 2 common operations - grid painting and adjusting of column sizes (text measuring of data in column cells). Grid painting is up to 1.3 times faster for .NET 5 than for .NET Framework 4.5.2. This means that the results of any data manipulation within the grid will be shown faster in .NET 5 application than .NET 4.5.2. Column size adjusting allows to fit the data in all columns up to 1.7 times faster for .NET 5.
See the .NET 5 FlexGrid performance improvements for yourself, by following along with this blog post using the measured data and benchmark application.

MESCIUS inc.