A break-even chart presents the relationship between cost and revenue to indicate profit and loss on different quantities with break-even point. It is also known as Cost Volume Profit graph.
Break-even point i.e., intersection point of the chart, shows the level of sales wherein total revenue is equal to the total costs and net income is equal to zero. Any number below the break-even point constitutes a loss while any number above it shows a profit. The chart plots revenue, fixed costs, and variable costs on the vertical axis, and volume on the horizontal axis.
The Break-Even chart can be highly useful in profit forecasting and planning to examine the effect of alternative business management decisions for your company. It allows end-user to see the unit volume sales level needed to achieve break even, based on which the user can decide whether it is possible to reach this sales level.
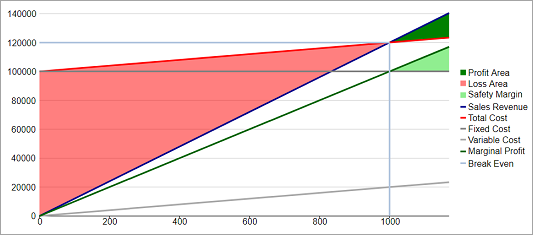
The following image shows a break-even chart created using the FlexChart control. In the example, based on the given data, the break-even point is 1000 units sold. At this point, sales revenue, and total cost, both are at 1,20,000 and equate each other. Till this point chart shows the loss and beyond this point it shows the profit.
In FlexChart, Break Even chart is represented by the BreakEven class. To create a Break-Even chart, you need to create a new BreakEven object, set values for the SalesPrice, FixedCost and VariableCost properties, and add it to the FlexChart SeriesCollection as demonstrated in the following code. Setting the values for these properties of a break-even chart helps you showcase the evolution of profits over time, and how long it takes to reach the break-even point where revenues surpass expenses.
| Razor |
Copy Code
|
|---|---|
@using C1.Blazor.Chart <FlexChart Class="chart"> <SeriesCollection> <C1.Blazor.Chart.BreakEven SalesPrice="120" FixedCost="100000" VariableCost="20" /> </SeriesCollection> </FlexChart> |
|