Funnel charts are the charts that help in visualizing the sequential stages in a linear process such as order fulfillment. In such processes, each stage represents a proportion (percentage) of the total. Therefore, the chart takes the funnel shape with the first stage being the largest and each following stage smaller than the predecessor. Funnel charts are useful in identifying potential problem areas in processes where it is noticeable at what stages and rate the values decrease. For instance, a an order fulfillment process that tracks number of orders getting across a stage, such as orders received, processed, approved, released, shipped, completed and finally delivered.
To create a Funnel chart through code, set up the data source through the ItemsSource property and configure the X and Y axes by setting the BindingX and Binding property. You also need to set up the chart by setting the ChartType property and other required properties.
| Razor |
Copy Code
|
|---|---|
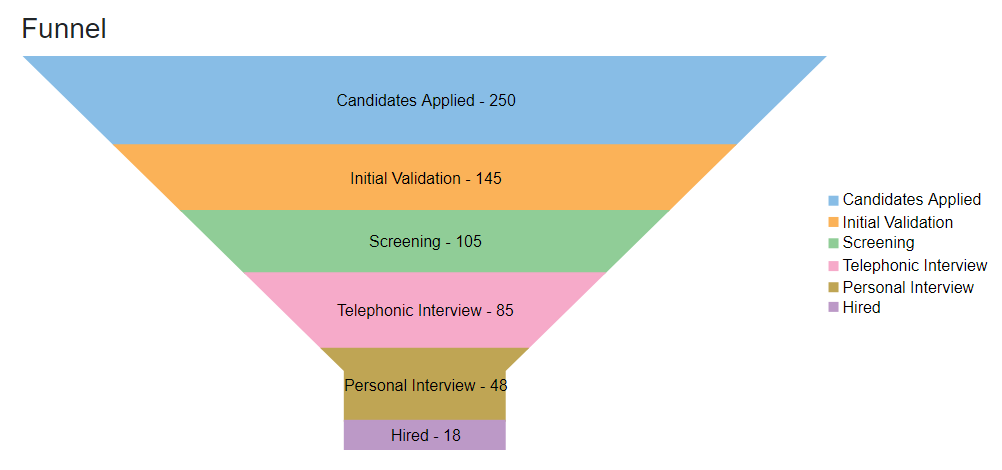
@using C1.Blazor.Chart <FlexChart @ref="chart" ChartType="C1.Chart.ChartType.Funnel" BindingX="Name" ItemsSource="data" > <SeriesCollection> <Series Binding="Value"></Series> </SeriesCollection> <AxisCollection> <Axis AxisType="C1.Chart.AxisType.Y" Position="C1.Chart.Position.None" /> <Axis AxisType="C1.Chart.AxisType.X" Position="C1.Chart.Position.None" /> </AxisCollection> <Label> <DataLabel Position="C1.Chart.LabelPosition.Center" Content="{name} - {value}" ></DataLabel> </Label> </FlexChart> @code { class FunnelData { public string Name { get; set; } public double Value { get; set; } public static List<FunnelData> GetDatas() { var data = new List<FunnelData>(); data.Add(new FunnelData { Name = "Candidates Applied", Value = 250 }); data.Add(new FunnelData { Name = "Initial Validation", Value = 145 }); data.Add(new FunnelData { Name = "Screening", Value = 105 }); data.Add(new FunnelData { Name = "Telephonic Interview", Value = 85 }); data.Add(new FunnelData { Name = "Personal Interview", Value = 48 }); data.Add(new FunnelData { Name = "Hired", Value = 18 }); return data; } } FlexChart chart; List<FunnelData> data; protected override void OnInitialized() { data = FunnelData.GetDatas(); } |
|