ASP.NET MVC Controls | ComponentOne
Working with Controls / FlexChart / Work with FlexChart / Series / Waterfall
In This Topic
    Waterfall
    In This Topic

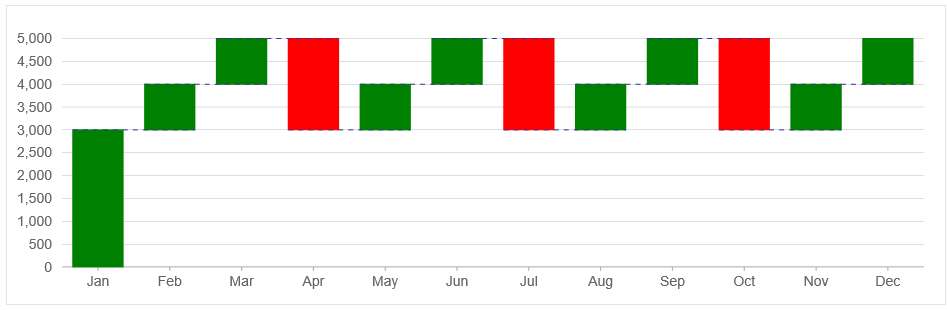
    Waterfall series is a form of data visualization that helps in understanding the progressive effect of positive and negative values in FlexChart. Waterfall series can be used for analytical purposes, mainly for understanding or explaining the continuous transition in the value, which is subjected to increase or decrease.

    This topic describes how to use Waterfall series in your FlexChart to represent the positives and negative values of an entity.

    To do so, follow the steps given below:

    WaterFall series in FlexChart

    Create a Datasource for FlexChart

    1. Add a new class to the folder Models (for example: Waterfall.cs). See Adding controls to know how to add a new model.
    2. Add the following code to the new model to define a class which will serve as a datasource for the FlexChart.
      C#
      Copy Code
      public class Waterfall
          {
              public int WaterfallId { get; set; }
              public string Name { get; set; }
              public int Value { get; set; }
              public Waterfall()
              {
              }
              public Waterfall(string name, int value)
              {
                  Name = name;
                  Value = value;
              }
              public static List<Waterfall> GetData()
              {
                  var names = new string[] { "Jan", "Feb", "Mar", "Apr", "May", "Jun", "Jul", "Aug", "Sep", "Oct", "Nov", "Dec" };
                  var data = new List<Waterfall>();
                  for (int i = 0, len = names.Length; i < len; i++)
                  {
                      data.Add(new Waterfall(names[i], (((i % 3) + 3) * 1000)));
                  };
                  return data;
              }
      }
      
    Back to Top

    Add a FlexChart

    Complete the following steps to initialize a FlexChart.

    Add a new Controller

    1. In the Solution Explorer, right click the folder Controllers.
    2. From the context menu, select Add | Controller. The Add Scaffold dialog appears.
    3. Complete the following steps in the Add Scaffold dialog:
      1. Select MVC 5 Controller - Empty template.
      2. Set name of the controller (for example: FlexChartController).
      3. Click Add.
    4. Include the MVC references as shown below.
      C#
      Copy Code
      using C1.Web.Mvc;
      using C1.Web.Mvc.Serializition;
      using C1.Web.Mvc.Chart;
      
    5. Replace the method Index() with the following method.
      C#
      Copy Code
      public ActionResult Index()
              {
                  return View(Waterfall.GetData());
              }
      

    Back to Top

    Add a View for the Controller

    1. From the Solution Explorer, expand the folder Controllers and double click the FlexChartController.
    2. Place the cursor inside the method Index().
    3. Right click and select Add View. The Add View dialog appears.
    4. In the Add View dialog, verify that the view name is Index and View engine is Razor (CSHTML).
    5. Click Add. A view is added for the controller.
      Razor
      Copy Code
      @model IEnumerable<Waterfall>
      @(Html.C1().FlexChart()
      .Bind("Name", "Value", Model)
      .Series(ser =>
      {
          ser.AddWaterfall()
          .RelativeData(false)
          .ConnectorLines(true)
          .Styles(s =>
          s.ConnectorLines(cnt => cnt.StrokeDasharray("5 5").Stroke("#339")));
      }).Height("300px"))
      

    Build and Run the Project

    1. Click Build | Build Solution to build the project.
    2. Press F5 to run the project.
      Append the folder name and view name to the generated URL (for example: http://localhost:1234/FlexChart/Index) in the address bar of the browser to see the view.
    Back to Top