FlexChart | ComponentOne
Chart Types / WinForms Pie Charts
In This Topic
    WinForms Pie Charts
    In This Topic

    Pie charts, the most common tools used for data visualization, are circular graphs that display the proportionate contribution of each category which is represented by a pie or a slice. The magnitude of the dependent variable is proportional to the angle of the slice. These charts can be used for plotting just one series with non-zero and positive values. For example, you can use a pie chart to show the market share of various automobile companies.

    WinForms Pie chart

    Create a WinForms Pie Chart

    FlexChart for WinForms provides pie chart through a stand alone control which is represented by the FlexPie class. You can bind the chart with data using the FlexPie.DataSource property provided by the FlexPie class. This class also provides FlexPie.Binding and FlexPie.BindingName properties for setting numeric values and labels of the pie chart slices. You can also specify the angle from where you want to start drawing the slices in the clock wise direction by setting the StartAngle property. FlexChart also lets you create following variations of pie chart:

    Doughnut Chart

    Exploded Pie Chart

    Reversed Pie Chart

    WinForms Doughnut Pie Chart WinForms Exploded Pie Chart WinForms Reversed Pie Chart

    To create a pie chart using FlexChart:

    At design-time

    1. Drag and drop the FlexPie control to the form.
    2. Right click the FlexPie control on form to open the Properties window.
    3. Set the data source using the DataSource property.
    4. Set the Binding and BindingName property.

    Using code

    To create a WinForms pie chart through code, the first step after initializing the FlexPie control is to clear the default series and add a new series using the Add method. Set up the data source through the DataSource property and set the BindingName and Binding property. You can also set up the chart further by setting the other required properties such as header content, data label content etc.

    //Binding FlexPie's AxisX to 'Value' so values appear in Horizontal axis
    flexPie1.Binding = "Value";
    
    flexPie1.BindingName = "Name";
    
    //Specify what and how to show data values
    flexPie1.DataLabel.Content = "{name} : {p:0}%";
    
    //Specify where to position the data labels relative to pie slices
    flexPie1.DataLabel.Position = PieLabelPosition.Radial;
    
    //Setting FlexPie's Header
    flexPie1.Header.Content = "Market Share of Automobile Companies";
    
    //Passing data in FlexPie
    flexPie1.DataSource = GetCarSales();
    
            ''' <summary>
            ''' Method for initializing FlexPie
            ''' </summary
            Protected Sub SetupChart()
    #Region "SetupChart"
                'Binding FlexPie's AxisX to 'Value' so values appear in Horizontal axis
                flexPie1.Binding = "Value"
    
                flexPie1.BindingName = "Name"
    
                'Specify what and how to show data values
                flexPie1.DataLabel.Content = "{name} : {p:0}%"
    
                'Specify where to position the data labels relative to pie slices
                flexPie1.DataLabel.Position = PieLabelPosition.Radial
    
                'Setting FlexPie's Header
                flexPie1.Header.Content = "Market Share of Automobile Companies"
    
                'Passing data in FlexPie
                flexPie1.DataSource = GetCarSales()
    

    Note that the above sample code uses a custom method named GetCarSales to supply data. You can set up the data source as per your requirements.

    /// <summary>
    /// Method for creating data for FlexPie
    /// </summary>
    public static List<CategoricalPoint> GetCarSales()
    {
        var data = new List<CategoricalPoint>()
        {
            new CategoricalPoint{Name="Maruti", Value=1643467},
            new CategoricalPoint{Name="Hyundai", Value=536241},
            new CategoricalPoint{Name="Mahindra", Value=248859},
            new CategoricalPoint{Name="Tata", Value=210200},
            new CategoricalPoint{Name="Honda", Value=170026},
            new CategoricalPoint{Name="Toyota", Value=140645},
            new CategoricalPoint{Name="Renault", Value=102222},
            new CategoricalPoint{Name="Ford", Value=90061},
        };
        return data;
    }
    
    ''' <summary>
    ''' Method for creating data for FlexPie
    ''' </summary>
    Public Shared Function GetCarSales() As List(Of CategoricalPoint)
        Dim data As List(Of CategoricalPoint) = New List(Of CategoricalPoint)() From {
            New CategoricalPoint() With {
                 .Name = "Maruti",
                 .Value = 1643467
            },
            New CategoricalPoint() With {
                 .Name = "Hyundai",
                 .Value = 536241
            },
            New CategoricalPoint() With {
                 .Name = "Mahindra",
                 .Value = 248859
            },
            New CategoricalPoint() With {
                 .Name = "Tata",
                 .Value = 210200
            },
            New CategoricalPoint() With {
                 .Name = "Honda",
                 .Value = 170026
            },
            New CategoricalPoint() With {
                 .Name = "Toyota",
                 .Value = 140645
            },
            New CategoricalPoint() With {
                 .Name = "Renault",
                 .Value = 102222
            },
            New CategoricalPoint() With {
                 .Name = "Ford",
                 .Value = 90061
            }
        }
        Return data
    End Function
    

    Create Multiple Pie Charts

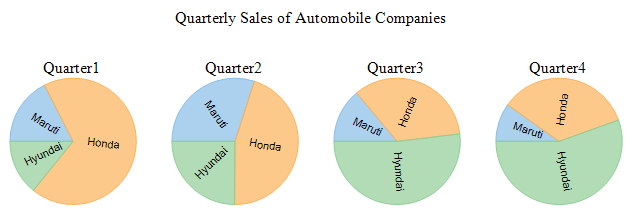
    While a single pie chart is used to present the part-to-whole relationship in a group, the multiple pies are required for presenting or comparing data across various groups. For example, you can use multiple pies to compare quarterly sales figures of various car brands. With FlexChart, you can achieve this by simply setting the comma-separated field names from a data source in Binding property of the FlexPie class.

    Multiple WinForms Pie charts

    //Bind the FlexPie control with datasource
    flexPie1.DataSource = data;
    flexPie1.BindingName = "Name";
                
    //Specify comma separated field names to render multiple pie charts
    flexPie1.Binding = "Q1,Q2,Q3,Q4";
                
    //Set titles of pie charts
    flexPie1.Titles = new []{ "Quarter1", "Quarter2", "Quarter3", "Quarter4"};
    
    //Set and position data labels for pie charts
    flexPie1.DataLabel.Content = "{name}";
    flexPie1.DataLabel.Position = C1.Chart.PieLabelPosition.Radial;
    
    'Bind the FlexPie control with datasource
    flexPie1.DataSource = data
    flexPie1.BindingName = "Name"
    
    'Specify comma separated field names to render multiple pie charts
    flexPie1.Binding = "Q1,Q2,Q3,Q4"
    
    'Set titles of pie charts
    flexPie1.Titles = New String() {"Quarter1", "Quarter2", "Quarter3", "Quarter4"}
    
    'Set and position data labels for pie charts
    flexPie1.DataLabel.Content = "{name}"
    flexPie1.DataLabel.Position = C1.Chart.PieLabelPosition.Radial