In tabular reports, the data is organized along the rows and columns of a Table data region. The data in the form of fields and entities is fetched from the data set added to the report.
What You Will Learn
This tutorial guides you through the steps to create a tabular report in ActiveReports Web Designer.
- Access the ActiveReports Web Designer
- Create Report Layout
- Bind Data to Table Data Region
- Sort Table Data
- Add Report Title
- Customize the Appearance of the Tabular Report
- Preview and Save Report
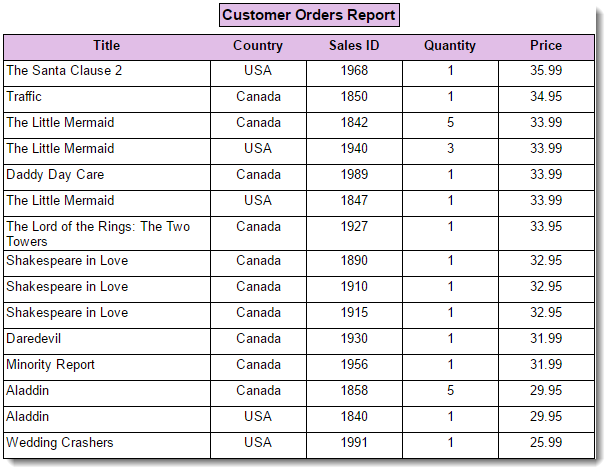
After you complete this tutorial, you will have a report that looks similar to the following.
Access the ActiveReports Web Designer
Run the Web Designer sample (WebDesigner_MVC(Core)) that you can download from the following link:
https://github.com/activereports/WebSamples14/tree/master/WebDesignerSamples
The Web Designer is opened in browser ready to create your reports.
Create Report Layout
- Drag and drop Table data region
 onto the design area of the report. By default, you have a table with three rows and three columns.

- To add more columns to the table, click inside the table to display the column handle, and then click the plus sign.
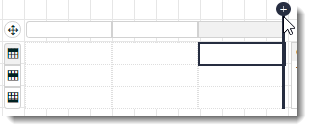
This adds one column to the table. Similarly, add another column to create a table with three rows and five columns.

Bind Data to Table Data Region
- To view fields in the data set, click the drop-down next to the CustomerOrders data set.
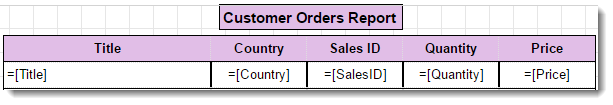
- To fill the table with data, drag and drop the fields onto the columns of the details row.

In our case, drag and drop the Title field on the first column, Country field on the second column, and so on as illustrated below. The Header row above the details row is automatically filled with labels.

- To remove the table footer, right-click the bottom row and select Remove Footer.
Note: The Data Set Name property of the table is automatically set to CustomerOrders.
Sort Table Data
You can sort the table data of any field in ascending or descending order. Let us sort our table data by Price field in descending order.
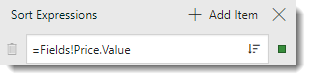
- From the adorner on the right side of the table, select <Details Group> and go to the Sort Expressions property.
- Click Show Items and then select Add Item.
- Click the radio button to display the fields and select the Price field to sort the table by price.
Note: You can also enter a sort expression in the Expression Editor: Data - Sort Expressions dialog by selecting Expression...
- Click descending
 icon to sort the Price field in descending order. You can change the sort order to ascending by clicking the ascending
  icon (default).
Add Report Title
- Drag and drop a TextBox control
 above the table. You may need to relocate the table to create space for the text box.
 - Click inside the text box and enter the text 'Customer Orders Report'.
Customize Appearance of Tabular Report
Note: You may need to resize and reposition the controls on the report to accommodate data, and for a cleaner look.
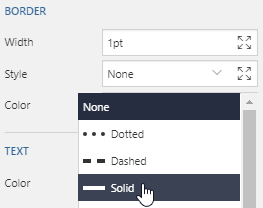
- To apply borders to the table, select the Table data region and set the BORDER - Style property to Solid.
- To customize Header row of the table, set the following properties for all text boxes in the row. Set the same properties to customize the title of the report, that is, the text box containing text 'Customer Orders Report'.
Property Value BACKGROUND - Color Plum

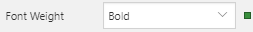
TEXT - Font Weight Bold
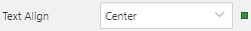
TEXT - Text Align Center
- To customize Details row of the table, select the cells in the details row by using Ctrl+Click and set the following properties.
Property Value BORDER - Style Solid
TEXT - Text Align
(except for the text box with 'Title' field)Center
Preview and Save Report
- Click Preview
 to view the final output of your report.
 - Exit the preview mode by clicking Back on the left side of the designer.
- Click Save to open the Save dialog box. Enter the report name and click Save Report.