Tutorial 6.3: Create a Dashboard Report
In This Topic
A dashboard report displays the data in different data regions, on a single display area, to help visualize and analyze the data at a glance. You can use charts, tables, and other controls, along with drill through feature to help design an interactive dashboard report.
What You Will Learn
This tutorial guides you through the steps to create a dashboard report.
Note: You need to complete Tutorial 6.2: Create Report with Drill-through in Chart before performing following steps.
- Add a Table Data Region and a TextBox control
- Bind Data to Table Data Region and Add text to TextBox control
- Manage Data in Table
- Customize the Appearance of Report
- Preview and Save Report
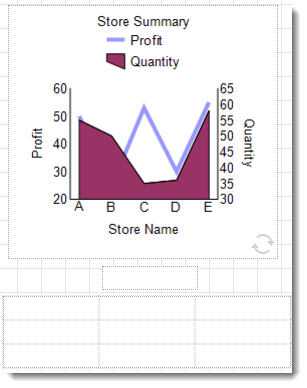
After you complete this tutorial, you will have a report that looks similar to the following.

Add a Table Data Region and a TextBox control
To give the report with chart a dashboard look, let us add a table to display the tabular data.
- On the design area of the report, drag and drop Table data region
 below the Chart data region.
 - To give title to the table, drag and drop a TextBox control
 between chart and table as shown.
Bind Data to Table Data Region and Add text to TextBox control
-
To fill the table with data,
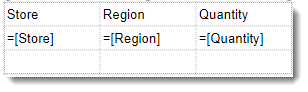
- In the details row, drag and drop the Store field on the first column, Region field on the second column, Quantity field on the third column. The Header row above the details row is automatically filled with labels.
- To remove the table footer, right-click the bottom row and select Remove Footer.
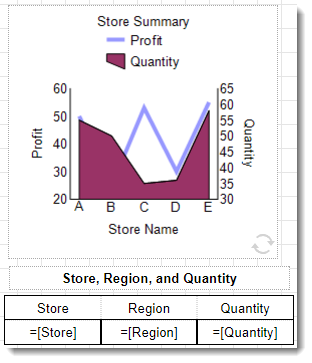
To add title to the table, - Select the TextBox added above the table.
- Enter the text 'Store, Region, and Quantity'.
Manage Data in Table
-
To group data in table according to the store value,
- From the Explorer
 , select the Table data region.
 - Go to Group Editor and select Table1_DetailsGroup1.
- In the Group Expressions property, click Show Items and then select Add Item.
- Click the radio button to display the fields and select the Store field.
To obtain the data in the ascending order of store value, - Select the table.
- Go to the Sort Expressions property, click Show Items and then select Add Item.
- Click the radio button to display the fields and select Store field.
Customize the Appearance of Report
See previous tutorials to customize the appearance of the table and the text box to look same as shown.
Preview and Save Report
- Click Preview
 to view your report in the final output.
You have a chart in which you can drill through to other report, along with the tabular data. - Exit the preview mode by clicking Back on the top left side of the designer.
- Click Save to open the Save dialog box. Enter the report name and click Save Report.
See Also