Area Chart
In This Topic
Area charts present each series as a point, connect the points with a line, and fill the area below the line. The y-axis values determine the heights of the points, while the x-axis displays the category labels. With an area chart, you can select from the following subtypes.
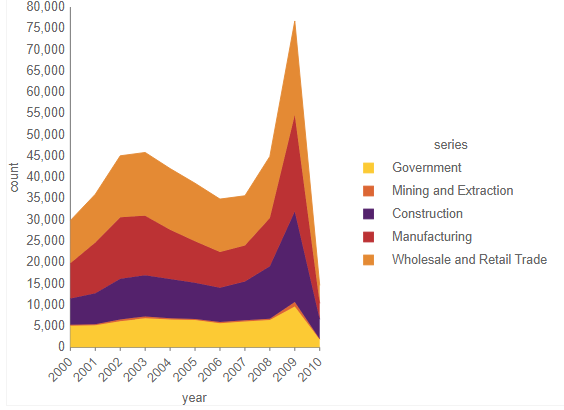
Area
Compare trends over a period of time or in specific categories.
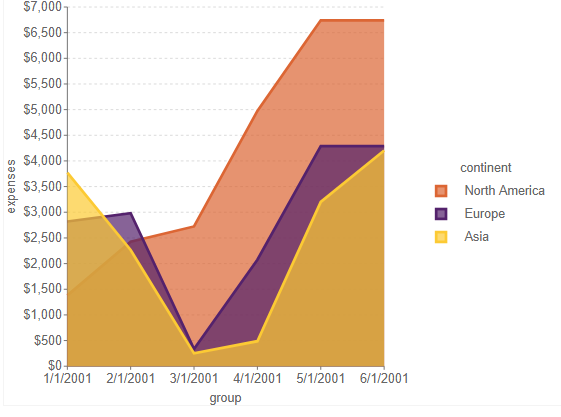
Stacked
An area chart with two or more data series stacked one on top of the other, shows how each value contributes to the total.
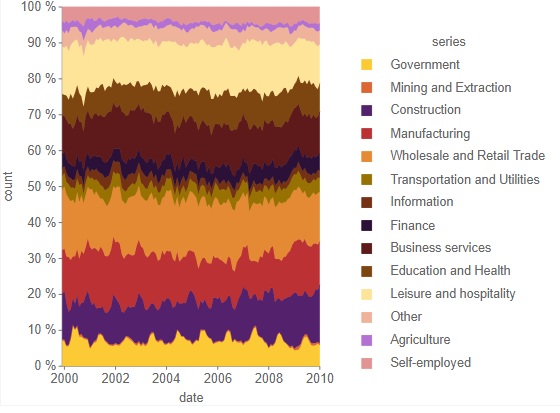
Percent Stacked
An area chart with two or more data series stacked one on top of the other to sum up to 100%, shows how each value contributes to the total with the relative size of each series representing its contribution to the total.