FinancialPortfolio_Angular
In This Topic
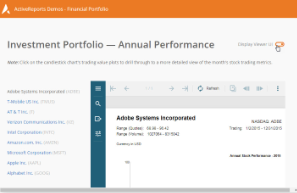
The Financial Portfolio sample demonstrates how to visualize stock data with a Candlestick Chart.
TestViewer
Note: To run this sample, you must have
- Visual Studio 2017 (https://visualstudio.microsoft.com/vs/) version 15.7 or newer.
- .NET Framework Dev Pack (https://dotnet.microsoft.com/download) version 4.6.2 or later.
- Angular requires the Node.js 8.x or 10.x version.
Sample Location
..\OnlineSamples14\FinancialPortfolio\
Details
When you run the sample, the start page with the Candlestick Chart appears. In the left panel, you can click a company from the list to see its stock data.
The project consists of the following elements.
- ClientApp folder: This folder contains a standard Angular CLI app that is used for all UI concerns.
- Controllers folder: This folder contains the ReportsController files. The ReportsController handles the interaction with reports when a report is selected in the left panel.
- Reports folder: The Reports folder contains the following reports - AnnualStockTicker.rdlx and MonthlyStockTradingData.rdlx.
- appsettings.json: The json configuration file.
- readme: This file contains the instructions on how to run the sample project.
- Startup.cs: This is the default startup file.
- Web.config: This configuration file contains the HttpHandlers that allow ActiveReports to process reports on the Web. Note that you need to manually update version information here when you update your version of ActiveReports.