Spiral Chart
In This Topic
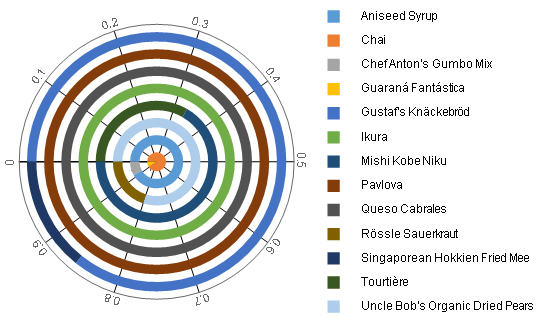
Spiral charts present data in the form of a spiral that is suitable for large data sets, showing trends over a long period of time. With a spiral chart, you can select from the following subtypes.
Spiral
Plots series along spirals, starting from the center of the circle.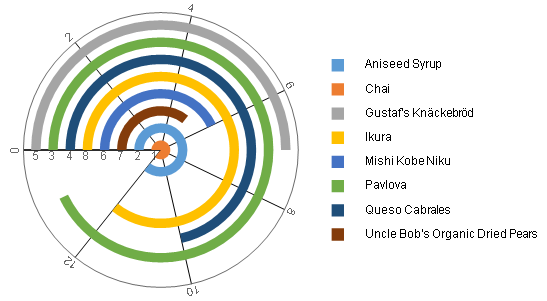
Stacked Spiral
Plots multiple series one on top of the other showing contribution of each value to the total.
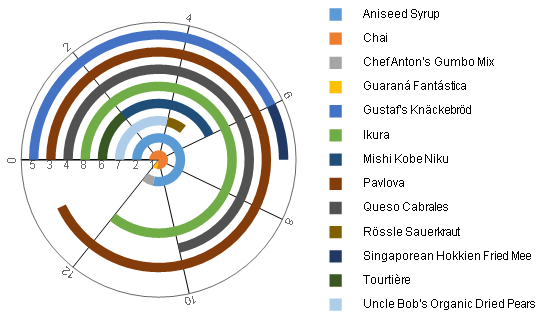
Percent Stacked Spiral
Plots multiple series one on top of the other showing percentage contribution of each value to the total.