
Get Started with Master-Detail Reports for Related DataSets
A master-detail report is a report that displays data structures that are related to each other by hierarchical relationships. For example, you can use such a report to visualize a list of orders containing the header(master data) and line items(detail data). ActiveReportsJS offers multiple ways to create master-detail reports. This tutorial will show you how to create a master-detail report from two datasets that are related by one-to-many relationships based on the same field value.
The first data set contains the Product Info(master data), and its objects look like this:
{
   "ProductId": 715,
   "Name": "Long-Sleeve Logo Jersey, L",
   "ProductNumber": "LJ-0192-L",
   "Color": "Multi",
   "Size": "L"
}
The second data set contains the Product Price History(detail data), and its objects look like this:
{
   "ProductId": 715,
   "StartDate": "2011-05-31",
   "EndDate": "2012-05-29",
   "ListPrice": 48.0673
}
One product may have multiple price history records. The master data and detail data are related by the ProductId field.
This tutorial builds the Product Inventory report from the ground up, providing experience with the typical report designing process. By the end, you will be able to do the following:
Create a new report
Bind the report to the OData API
Use the OData $select and $filter query options to reduce the volume of retrieved data
Use field tags to define the data type of a field.
Create a Table data region to display the
Masterdata.Format rows, columns, and cells of the table.
Add a nested List data region to display the
Detaildata.Set filters for the nested List.
Use the Format function to display formatted data.
Upon completing all tutorial steps, the final report will look like this: live demo.
Prerequisites
The following content assumes that you have the Standalone Report Designer running. Visit the tutorial for detailed information. A stable internet connection is also required to access the Demo Data Hub.
Creating a New Report
In the standalone report designer, click the File menu and select the Continuous Page Layout template for a newly created report. Click anywhere on the gray area around the report layout to load the report properties in the properties panel. In the Margins section, set the Style property to Narrow to change the report page margins size.
Expand to watch creating a new report in action
Data Binding
Data Binding establishes a connection between a report and the data it displays. We use the MESCIUS Demo OData API that contains the data for a fictitious company called AdventureWorks that manufactures and sells bicycles worldwide.
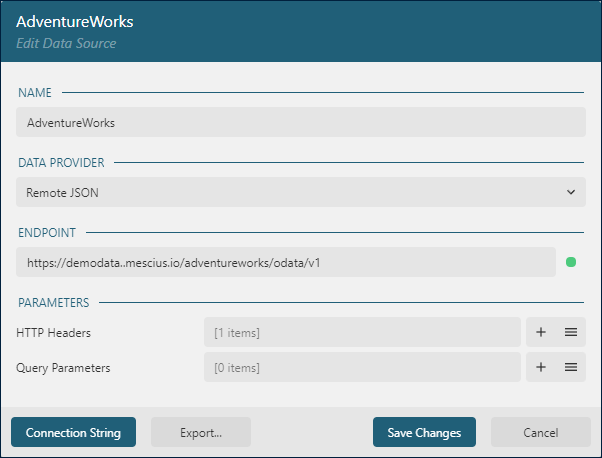
Adding Data Source
You can think of the AdventureWorks OData API as the "database" that you can connect to using its root URL https://demodata..mescius.io/adventureworks/odata/v1, and that has multiple "tables" which presented with endpoints such as /Customers, /Stores, and /Products. Using the following steps, you can create a Report DataSource that establishes the connection to such a "database."
Open the Data panel of the property inspector and click the
Addbutton.In the Data Source editor dialog, type
AdventureWorksin theNAMEfield andhttps://demodata..mescius.io/adventureworks/odata/v1in theENDPOINTfield.Click the
Save Changesbutton.
Adding Data Sets
Data Sets represent one or more endpoints of the Data Source. For the Product Inventory Report, we need to access the data from the /Products and /ProductListPriceHistories endpoints of the AdventureWorks Data Source that we added in the previous section. The data exposed by these end-points are related by the ProductId field.
Use the following steps to add the Products data set:
Click the
+icon nearAdventureWorksin the Data panel.In the Data Set Editor dialog, type
Productsin the NAME field,/Productsin the Uri/Path field, and$.value.*in theJson Pathfield.By default, each
Productrecord includes 25 fields, but we don't need them all. Therefore we limit the retrieved fields by applying the OData $select query option via a query parameter.Click the
+icon on the right side of theParameterssection.Type
$selectin theParameterfield of the newly addedParameteritem.Type
ProductId, ProductNumber,Name,Color,Sizein theValuefield of the sameParameteritem.
By applying the $filter query option, we can further reduce the volume of data retrieved.
Click the
+icon on the right side of theParameterssection.Type
$filterin theParameterfield of the newly addedParameteritem.Type
ProductId+gt+714+and+ProductSubCategoryId+eq+21in theValuefield of the sameParameteritem.
Click the
Validatebutton.Ensure that the
DataBase Fieldssection displays[5 items]text.Click the
Save Changesbutton.
Expand to watch adding the Products data set in action
Similarly, add the ProductListPriceHistories data set:
Click the
+icon nearAdventureWorksin the Data panel.In the Data Set Editor dialog, type
ProductListPriceHistoriesin the NAME field,/ProductListPriceHistoriesin the Uri/Path field, and$.value.*in theJson Pathfield.By applying the $filter query option, we can further reduce the volume of data retrieved.
Click the
+icon on the right side of theParameterssection.Type
$filterin theParameterfield of the newly addedParameteritem.Type
ProductId+gt+714in theValuefield of the sameParameteritem.
Click the
Validatebutton.Ensure that the
DataBase Fieldssection displays[5 items]text.Expand the
DataBase Fieldssection and set theDataFieldproperty of theStartDateand theEndDatefields toStartDate[Date]andEndDate[Date], respectively.Click the
Save Changesbutton.
Adding Table Data Region
To display the product information(master data) we will use the Table Data Region. There are several ways to add a new table into the report. We will use the quick way for this tutorial:
Expand the
Productsdata set in the Data panel using the chevron-down icon.Click the
Select fieldsicon near theProductsdata set name.Select
ProductNumber,Name,Color, andSizefields.Drag and Drop selected fields into a top left corner of a report layout.
Expand to watch adding the table data region in action
The newly created table has four columns, one per each field of the dataset, the header row that displays the field names, and the details row that shows the values of the fields.
Formatting Table Columns
All the columns of the newly created table have the same width, and it needs to be adjusted according to the data displayed in each column. To do this, click anywhere inside the table so that it shows the columns and rows handlers and follow the next steps:
Click the first column handler and set its
Widthto2.5inin the Properties panelClick the second column handler and set its
Widthto2inin the Properties panelClick the third column handler and set its
Widthto1inin the Properties panelClick the fourth column handler and set its
Widthto2inin the Properties panel
Expand to watch setting columns widths in action
Adding Table Rows
The table currently has only two rows. The following steps add one more row for the table header to show the report title and two more rows for the table details to display the product price history.
Right-click the first row handler and select the
Row > Insert Row Aboveitem the drop-down menuIn the same manner, insert two rows below the last row.
Expand to watch adding rows below the details in action
Merging Table Cells
The first row of the table will display the report title. Therefore, it is convenient to merge the cells of the first row:
Click the first cell of the first row, press the
Ctrlbutton on Windows orCmdon Mac OS, and click the 2nd, 3rd, and 4th cells on the same rowRight click on the selection and select the
Cells > Merge Cellsitem in the drop-down menu. The row now has a single cell that occupies four columns
Repeat the same procedure for the last two rows of the table - they will host the title and the nested List for the detail data.
Expand to watch merging cells in action
Formatting the Report Title
The first row of the table should display the report title. Follow the next steps to format the row accordingly.
Click the handler of the first row and set its
Heightproperty to0.5inin the Property InspectorSwitch to the
TextBoxtab in the Property inspector and set the following properties for the text of the report title
Property | Value |
|---|---|
Value | Product Inventory |
Color | #3da7a8 |
Font Size | 24pt |
Font Weight | Bold |
Vertical Align | Middle |
Expand to watch formatting the title in action
Formatting Column Headers
The second row of the table contains the column headers. Using the same steps as for the report title, set the following properties for the row height and the text displayed in the row's cells.
Property | Value |
|---|---|
Row Height | 0.5in |
Border Width | 2pt |
Border Style | None None None Solid |
Bolder Color | #40cddf |
Font Weight | Bold |
Vertical Align | Middle |
Formatting Master Data
The third row of the table repeats for each data record of the Products dataset. Set the following properties for the row height and the text displayed in the cells of the row.
Property | Value |
|---|---|
Row Height | 0.4in |
Border Width | 1pt |
Border Style | None Dotted None None |
Border Color | #ccc |
Vertical Align | Middle |
Formatting Detail Data Title
The 4th row of the table should display the title of the nested List for the detail data. Set the following properties for the row height and the text displayed in the cells of the row.
Property | Value |
|---|---|
Row Height | 0.4in |
Value | Price History |
Font Size | 12pt |
Font Weight | Bold |
Vertical Align | Middle |
Adding nested data region
The last row of the table should display the price history for the current product. To do that, add the nested List to the row using the following steps:
Click the handler of the last row and set its
Heightproperty to0.35inin the Property InspectorExpand the toolbox using the
Hamburgermenu located on the toolbar's left sideDrag and drop the List item from the toolbox into the last row of the table
In the Property Inspector of the newly added List set the
DataSet Nameproperty toProductListPriceHistoriesIn the Property Inspector, click the Filters editor's
+ Addbutton.In the filter UI, click the
Add...button, select theProductIdfield in the drop-down menu, type{ProductId}in the box on the right side of=sign and click theBack Arrowbutton in the header to return to the property inspector.
Expand to watch adding the nested List in action
Displaying the detail data
Drag and drop two TextBox items from the toolbox into the List and set the following properties for newly added textboxes:
Property | 1st textbox | 2nd textbox |
|---|---|---|
Value | {Format(StartDate, "d")} - {IIF(EndDate, Format(EndDate, "d"), Format(Now(), "d"))} | {Format(ListPrice, "c2")} |
Color | #0096aa | #0096aa |
Text Align | Leave as Default | Right |
Left | 0 | 6.25in |
Top | 0 | 0 |
Width | 3.25in | 1.25in |
Height | 0.35in | 0.35in |
Preview the report output
You can now preview the report output and notice that the following information is displayed for each product:
Product Name, Number, Size, and Color(Master data)
Product Price History(Detail data)
The final version of the report is available at the demo website.