
Get Started With Summary Reports
Introduction
A summary report is a method of reducing a complete, often large, set of raw data into smaller views that help yield useful information. Usually, a summary report condenses many data records into several categories and displays one or more summary values for each of these categories. A summary report can also group, sort, and filter the data based on pre-defined conditions or user input. In ActiveReportsJS you can build such a report using Tablix and/or Chart data regions. Tablix is a combination of words Table and Matrix. You can think of it as an advanced Pivot Table, similar to Excel one.
In this tutorial, we build a Tablix-based Sales Report from the ground up, providing experience with the typical report designing process. By the end, you will be able to do the following:
Create a new report
Bind the report to the OData API with multiple endpoints
Create the report parameter for interaction with a report reader
Use the
Galley modeof the report viewerUse the OData $select and $filter query options to reduce the volume of retrieved data
Create data set calculated fields
Create a tablix data region
Configure the tablix using the Tablix Wizard
Format rows and columns of the tablix data region
Use the Lookup function to display the data from multiple data sets
Sort tablix columns
Upon completion of all tutorial steps, the final report will look like this: live demo.
Prerequisites
The following content assumes that you have the Standalone Report Designer running. Visit the tutorial for detailed information. A stable internet connection is also required to access the Demo Data Hub.
Creating a New Report
In the standalone report designer, click the File menu and select the Continuous Page Layout template for a newly created report. Click anywhere on the gray area around the report layout to load the report properties in the Properties panel. In the Margins section, set the Style property to Narrow to change the report page margins size.
Expand to watch creating a new report in action
Data Binding
Data Binding establishes a connection between the report and the data it displays. In this tutorial, we use the MESCIUS Demo OData API that contains the sales data for a fictitious company called Contoso that is a manufacturing, sales, and support organization with more than 100,000 products.
Adding Data Source
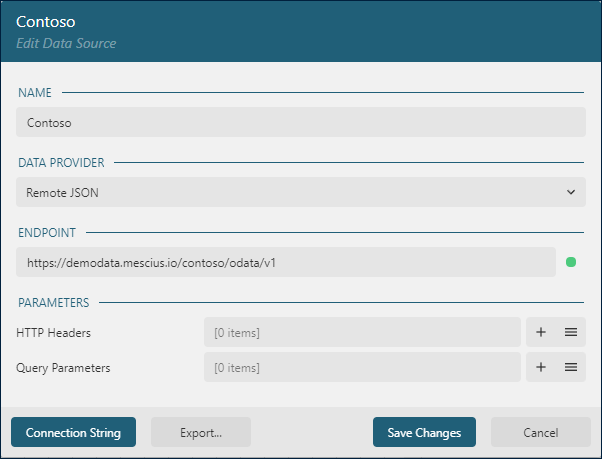
You can think of the Contoso OData API as the "database" that you can connect to using its root URL https://demodata.mescius.io/contoso/odata/v1, and that has multiple "tables" which presented with endpoints such as /DimCustomers, /DimStores, and /DimProducts. You can create a Report DataSource that establishes the connection to such a "database" using the following steps.
Open the Data panel of the property inspector and click the
Addbutton.In the Data Source editor dialog, type
Contosoin the NAME field andhttps://demodata.mescius.io/contoso/odata/v1in the ENDPOINT field.Click the
Save Changesbutton
Adding Supplemental Data Sets
Data Sets represent one or more endpoints of the Data Source. For the Sales Report, we need to have access to the data from the /DimStores, /DimChannels and /FactSales endpoints of the Contoso Data Source that we added in the previous section. The first two data sets are supplemental. We will use them to list the available values for a report parameter and display store names and sales channel names. We will use the FactSales data set to build the summary data.
Use the following steps to add the Stores data set:
Click the
+icon nearContosoin the Data panel.In the Data Set Editor dialog, type
Storesin the NAME field,/DimStoresin the Uri/Path field, and$.value.*in theJson Pathfield.By default, each
Storerecord includes 23 fields, but we don't need them all. Therefore we limit the retrieved fields by employing the OData $select query option via aquery parameterClick the
+icon on the right side of theParameterssection.Type
$selectin theParameterfield of the newly addedParameteritem.Type
StoreKey, StoreNamein theValuefield of the sameParameteritem.
Click the
Validatebutton.Ensure that the
DataBase Fieldssection displays[2 items]text.Click the
Save Changesbutton.
Expand to watch adding the Stores data set in action
Next, add the Channels data set with the same approach:
Click the
+icon nearContosoin the Data panel.In the Data Set Editor dialog, type
Channelsin the NAME field,/DimChannelsin the Uri/Path field, and$.value.*in the Json Path field.By default, each
Channelrecord includes seven fields, but we don't need them all. Therefore we limit the retrieved fields by applying the OData $select query option via a query parameter.Click the
+icon on the right side of theParameterssection.Type
$selectin theParameterfield of the newly addedParameteritem.Type
ChannelKey, ChannelNamein theValuefield of the sameParameteritem.
Click the
Validatebutton.Ensure that the
DataBase Fieldssection displays[2 items]text.Click the
Save Changesbutton.
Adding Report Parameter
The Sales Report that we are building should ask a reader for the Sales Channel to display the summary data for. Using report parameters is the primary method for such an user input. Follow the next steps to create the SalesChannel report parameter.
In the Data panel click the
+ Addbutton in theParametersSection.Type
SalesChannelin theNamefield andSelect the Sales Channelin thePromptfield.Select
Integerin theData Typedrop-down.In the
Available Valuessection selectChannelsfor theData Set Name,ChannelKeyfor theValue Field, andChannelNamefor theLabel Field.
Expand to watch adding the report parameter in action
Using the Galley Mode for Preview
You can preview the report output and notice that the Parameters panel appears and asks to select the sales channel from the list of pre-determined values. These values come from the Channels data set at preview time. Therefore, if a new sales channel appears in the data, the report parameter selection will update the available values list.
Select any value and click the Preview button. The report displays the blank page because we haven't added any report items yet.
Click the rightmost button, called Galley Mode, on the report viewer toolbar. This button switches the viewer mode to display the unpaginated output that is suitable for reading summary reports. Thus, the blank page disappears, but that is perfectly fine. The report output will appear later.
Expand to watch switching to Galley Mode in action
Adding Sales Data Set
Next, we will add the Sales data set containing the actual data that the report will visualize.
Go back to the report design and exit the Parameter Editor by clicking the Left Arrow icon near the
EDIT PARAMETERheader.Click the
+icon nearContosoin the Data panel.In the Data Set Editor dialog, type
Salesin the NAME field,/FactSalesin the Uri/Path field, and$.value.*in the Json Path field.By default, each
FactSalesrecord includes 19 fields, but we don't need them all. Therefore we limit the retrieved fields by applying the OData $select query option via the query parameter.Click the
+icon on the right side of theParameterssection.Type
$selectin theParameterfield of the newly addedParameteritem.Type
DateKey,StoreKey,SalesAmountin theValuefield of the sameParameteritem.
By default, the
FactSalesdata set includes data for all the sales channels, but the report should only display the selected sales channel's data. Therefore we filter the retrieved data by using the OData $filter query option via the query parameter. The filter value is bound to the report parameter that we added in the previous step.Click the
+icon on the right side of theParameterssection.Type
$filterin theParameterfield of the newly addedParameteritem.Type
ChannelKey+eq+{@SalesChannel}in theValuefield of the sameParameteritem.
Click the
Validatebutton.In the Parameter Prompt that appears, type
1in the@SalesChannelfield and click theSave & Runbutton.Ensure that the
DataBase Fieldssection displays[3 items]text.
Adding Calculated Field
The Sales data set includes the DateKey field that is the sale date in YYYY-MM-DD format. To simplify report development, we now add the calculated field that will contain the year of the sale date. We assume that you keep the Sales data set editor open.
Click the
+icon on the right side of theCalculated Fieldssection.Type
SaleYearin theField Namefield of the newly added item.Type
{Year(DateKey)}in theValuefield of the same item.Click the
Save Changesbutton in theSalesdata set editor dialog.
Adding Tablix Data Region
To display the summary data from the Sales data set we will use the Tablix data region:
Expand the toolbox using the
Hamburgermenu located on the left side of the toolbar.Drag and drop the
Tablixitem from the toolbox to the top-left corner of the report page area. The Tablix Wizard will appear.In the tablix wizard drag and drop expand the
Salesnode in theData Setslist.Drag and drop the
StoreKeyfield to theRow Groupsarea.Drag and drop the
SaleYearfield to theColumn Groupsarea.Click the
sorticon on the right side of theSalesYearand selectAscendingin the drop down menu.Drag and drop the
SalesAmountfield to theValuesarea.Click the
Σicon on the right side of theCount(SalesAmount)item and selectSumin the drop down menu.Click the
gearicon that resides next toΣand selectCurrencyin the drop down menu.Click the
Totals for Row GroupsandTotals for Column Groupscheckboxes in theTotalstab of theLayout Optionsarea.Click the
OKbutton.
With this configuration, the tablix will generate rows for each unique Store Key, columns for each Sale Year, and display the sum of SalesAmount in their intersection. Additional rows and columns will show the grand totals for each store and each year.
Expand to watch how to set up the Values and Totals in action
You can preview the report output, try to choose different sales channels in the parameter panel, and notice that the report displays the summary data for the selected channel only. The tablix needs to be well-formatted, though.
Formatting Tablix Rows
Follow the next steps to format tablix rows.
Go back to the report design and click anywhere inside the tablix to display the columns and rows handlers of the tablix designer.
Press the
Ctrlbutton on Windows orCmdon Mac OS and click each row handler of the tablix to select all the rows.Set the
Heightproperty of the selected rows to0.3inin the property inspectorSwitch to the
TEXTBOXtab in the Property inspector. You can now modify the properties of all the tablix cells of selected rows.Set the
Border Widthproperty to0.25ptSet the
Border Styleproperty toSolidSet the
Border Colorproperty toGainsboroSet the
Vertical Alignproperty toMiddle
Expand to watch formatting tablix row in action
In the same manner, select the first and the third tablix rows by clicking the corresponding row handlers.
Switch to the
TEXTBOXtab in the Property inspector.Set the
FontWeightproperty toBold.Select the first tablix row.
Switch to the
TEXTBOXtab in the Property inspector.Set the
BackgroundColorproperty to#f7f7f7.
Formatting Tablix Columns
Follow the next steps to format tablix columns.
Click the first column handler and set its
Widthto2inin the Property inspector.Switch to the
TEXTBOXtab in the Property inspector.Expand the
Paddingeditor using the icon on its right side and set theLeft Paddingproperty to6ptClick the last column handler. The
TEXTBOXtab in the Property inspector is still active.Set the
FontWeightproperty toBold.Set the
TextAlignproperty toRight.
Expand to watch formatting the first column in action
You can preview the report output, select any sales channel, and notice that it is now a bit more accurate.
Displaying fields from multiple data sets
Displaying the StoreKey in the first column of the tablix rows is not very informative, so let's display the Store Name instead. The Sales data set does not contain the StoreName field, but the Stores data set does. We will use the Lookup function to resolve the Store Name by its Key.
Go back to the report design.
Double click the tablix cell on the first column of the second row. It displays the
{StoreKey}text.Replace this text with
{Lookup(StoreKey, StoreKey, StoreName, "Stores")}. This function takes the value of the first argument in the current scope - theStoreKeyof the current tablix row - finds the row with the sameStoreKeyvalue in theStoresdata set and returns the correspondingStoreNamevalue.
In the same manner, we can display the name of the selected Sales Channel in the tablix corner
Double click the tablix cell on the first column of the first row. It displays the
Store Keytext.Replace this text with
Annual {Lookup(@SalesChannel, ChannelKey, ChannelName, "Channels")} Sales. TheLookupfunction takes the value of the first argument that is the currentSalesChannelparameter value, finds the row with the sameChannelKeyvalue in theChannelsdata set and returns the correspondingChannelNamevalue. At the preview time, this expression will display values likeAnnual Online Sales
Expand to watch adding Store Name and Channel Name Lookup Resolution in action
You can preview the report output, select any sales channel, preview the output, and notice that it now displays both Sales Channel Name and Store Names.
The final version of report is available at the demo web-site.