[{"id":"e0909540-8bde-4587-bb4d-02445746db2a","tags":[{"name":"upd","color":"#7e678a","productId":"d699a6af-e150-4da3-ab30-25fd97934601","links":null,"id":"fe610228-9cf6-417f-813a-dcbfd25406c3"}]},{"id":"464b8e03-462d-4aed-8818-05d32ec3bf00","tags":[{"name":"upd","color":"#7e678a","productId":"d699a6af-e150-4da3-ab30-25fd97934601","links":null,"id":"fe610228-9cf6-417f-813a-dcbfd25406c3"}]},{"id":"75b66fd4-b740-443d-bc6e-1782048b60a6","tags":[{"name":"upd","color":"#7e678a","productId":"d699a6af-e150-4da3-ab30-25fd97934601","links":null,"id":"fe610228-9cf6-417f-813a-dcbfd25406c3"}]},{"id":"fd5d021d-0210-4d74-ba42-1a39ef14a385","tags":[{"name":"upd","color":"#7e678a","productId":"d699a6af-e150-4da3-ab30-25fd97934601","links":null,"id":"fe610228-9cf6-417f-813a-dcbfd25406c3"}]},{"id":"a20f26ac-cd31-4e4d-9454-1e035b0f1587","tags":[{"name":"upd","color":"#7e678a","productId":"d699a6af-e150-4da3-ab30-25fd97934601","links":null,"id":"fe610228-9cf6-417f-813a-dcbfd25406c3"}]},{"id":"7fce7040-1bb1-4a61-9fb7-2e19d569de50","tags":[{"name":"upd","color":"#7e678a","productId":"d699a6af-e150-4da3-ab30-25fd97934601","links":null,"id":"fe610228-9cf6-417f-813a-dcbfd25406c3"}]},{"id":"f235557b-9781-471f-bf03-38bae6e3e953","tags":[{"name":"upd","color":"#7e678a","productId":"d699a6af-e150-4da3-ab30-25fd97934601","links":null,"id":"fe610228-9cf6-417f-813a-dcbfd25406c3"}]},{"id":"c8c7b5d5-f5bd-4b68-a12f-3aae9804a844","tags":[{"name":"upd","color":"#7e678a","productId":"d699a6af-e150-4da3-ab30-25fd97934601","links":null,"id":"fe610228-9cf6-417f-813a-dcbfd25406c3"}]},{"id":"dde44832-bb5c-45f3-8ebf-3badbc613cd9","tags":[{"name":"upd","color":"#7e678a","productId":"d699a6af-e150-4da3-ab30-25fd97934601","links":null,"id":"fe610228-9cf6-417f-813a-dcbfd25406c3"}]},{"id":"a0c823ed-e22b-493b-aded-4d201c0fa480","tags":[{"name":"upd","color":"#7e678a","productId":"d699a6af-e150-4da3-ab30-25fd97934601","links":null,"id":"fe610228-9cf6-417f-813a-dcbfd25406c3"}]},{"id":"2f064d57-b088-4bc5-a628-4e0d7e1a0c65","tags":[{"name":"upd","color":"#7e678a","productId":"d699a6af-e150-4da3-ab30-25fd97934601","links":null,"id":"fe610228-9cf6-417f-813a-dcbfd25406c3"}]},{"id":"577a09da-dea1-42db-812f-4eeaa9274ece","tags":[{"name":"upd","color":"#7e678a","productId":"d699a6af-e150-4da3-ab30-25fd97934601","links":null,"id":"fe610228-9cf6-417f-813a-dcbfd25406c3"}]},{"id":"0eb72dd3-8f8f-4039-93a8-500bbde2301e","tags":[{"name":"upd","color":"#7e678a","productId":"d699a6af-e150-4da3-ab30-25fd97934601","links":null,"id":"fe610228-9cf6-417f-813a-dcbfd25406c3"}]},{"id":"3f2ea860-c764-43d8-ae3f-6e3b0314ce67","tags":[{"name":"upd","color":"#7e678a","productId":"d699a6af-e150-4da3-ab30-25fd97934601","links":null,"id":"fe610228-9cf6-417f-813a-dcbfd25406c3"}]},{"id":"3604b8ce-1da0-413f-8274-7df0f7173573","tags":[{"name":"upd","color":"#7e678a","productId":"d699a6af-e150-4da3-ab30-25fd97934601","links":null,"id":"fe610228-9cf6-417f-813a-dcbfd25406c3"}]},{"id":"f290406b-ced1-4c52-abad-979160a79f6b","tags":[{"name":"upd","color":"#7e678a","productId":"d699a6af-e150-4da3-ab30-25fd97934601","links":null,"id":"fe610228-9cf6-417f-813a-dcbfd25406c3"}]},{"id":"d19bc9cd-ff53-4b0d-ab7e-a68c1497c4c6","tags":[{"name":"new","color":"#ed7422","productId":"d699a6af-e150-4da3-ab30-25fd97934601","links":null,"id":"4d7b6a40-ab32-4c71-a381-58f3ffd2653e"}]},{"id":"ac046cee-82b9-4edf-a642-ae6d7cb21ebf","tags":[{"name":"upd","color":"#7e678a","productId":"d699a6af-e150-4da3-ab30-25fd97934601","links":null,"id":"fe610228-9cf6-417f-813a-dcbfd25406c3"}]},{"id":"81eb70e8-f770-4384-9167-bc7c755ad052","tags":[{"name":"new","color":"#ed7422","productId":"d699a6af-e150-4da3-ab30-25fd97934601","links":null,"id":"4d7b6a40-ab32-4c71-a381-58f3ffd2653e"}]},{"id":"1864834b-08ce-43f1-891b-c3cca6e04e95","tags":[{"name":"new","color":"#ed7422","productId":"d699a6af-e150-4da3-ab30-25fd97934601","links":null,"id":"4d7b6a40-ab32-4c71-a381-58f3ffd2653e"}]},{"id":"f96cfec1-420c-4ca7-ab0a-cab482731073","tags":[{"name":"new","color":"#ed7422","productId":"d699a6af-e150-4da3-ab30-25fd97934601","links":null,"id":"4d7b6a40-ab32-4c71-a381-58f3ffd2653e"}]},{"id":"d0dff477-9f56-483a-a9fc-cab648905b41","tags":[{"name":"new","color":"#ed7422","productId":"d699a6af-e150-4da3-ab30-25fd97934601","links":null,"id":"4d7b6a40-ab32-4c71-a381-58f3ffd2653e"}]},{"id":"548568fe-dbd1-4da5-a489-d9b3edf75329","tags":[{"name":"upd","color":"#7e678a","productId":"d699a6af-e150-4da3-ab30-25fd97934601","links":null,"id":"fe610228-9cf6-417f-813a-dcbfd25406c3"}]},{"id":"27658163-a479-432f-a192-dbed286beb3e","tags":[{"name":"new","color":"#ed7422","productId":"d699a6af-e150-4da3-ab30-25fd97934601","links":null,"id":"4d7b6a40-ab32-4c71-a381-58f3ffd2653e"}]},{"id":"793a62d7-460d-4699-9304-edb2941268ac","tags":[{"name":"upd","color":"#7e678a","productId":"d699a6af-e150-4da3-ab30-25fd97934601","links":null,"id":"fe610228-9cf6-417f-813a-dcbfd25406c3"}]},{"id":"8ddd80d5-886f-41b8-8e3f-f73aa8146c8d","tags":[{"name":"upd","color":"#7e678a","productId":"d699a6af-e150-4da3-ab30-25fd97934601","links":null,"id":"fe610228-9cf6-417f-813a-dcbfd25406c3"}]},{"id":"43de3664-261b-4cf9-9945-fb519251f4c7","tags":[{"name":"upd","color":"#7e678a","productId":"d699a6af-e150-4da3-ab30-25fd97934601","links":null,"id":"fe610228-9cf6-417f-813a-dcbfd25406c3"}]},{"id":"94759fce-692f-4779-b5f3-fce5c58f242c","tags":[{"name":"new","color":"#ed7422","productId":"d699a6af-e150-4da3-ab30-25fd97934601","links":null,"id":"4d7b6a40-ab32-4c71-a381-58f3ffd2653e"}]},{"id":"2d6ebfad-f7d1-4cc5-8ba1-fdace3472056","tags":[{"name":"upd","color":"#7e678a","productId":"d699a6af-e150-4da3-ab30-25fd97934601","links":null,"id":"fe610228-9cf6-417f-813a-dcbfd25406c3"}]}]
        
(Showing Draft Content)

Chart

Introduction

A chart is a graphical representation that helps a report reader observe data changes over periods, compare different data groups or parts of a whole, determine relationships between variables, etc.


In ActiveReportsJS, you can use the following chart types to design such data visualizations:

  • Column, Stacked Column, Stacked Percentage Column, and Range Column

  • Bar, Stacked Bar, Stacked Percentage Bar, and Range Bar

  • Line, Smooth Line, and Stepped Line

  • Area, Stacked Area, and Stacked Percentage Area

  • Pie, Doughnut, and Circular Bar

  • Spiral, Stacked Spiral, and Stacked Percentage Spiral

  • Polar, Stacked Polar, and Stacked Percentage Polar

  • Scatter and Bubble

  • Candlestick, High Low Close, and High Low Open Close

  • Gauge

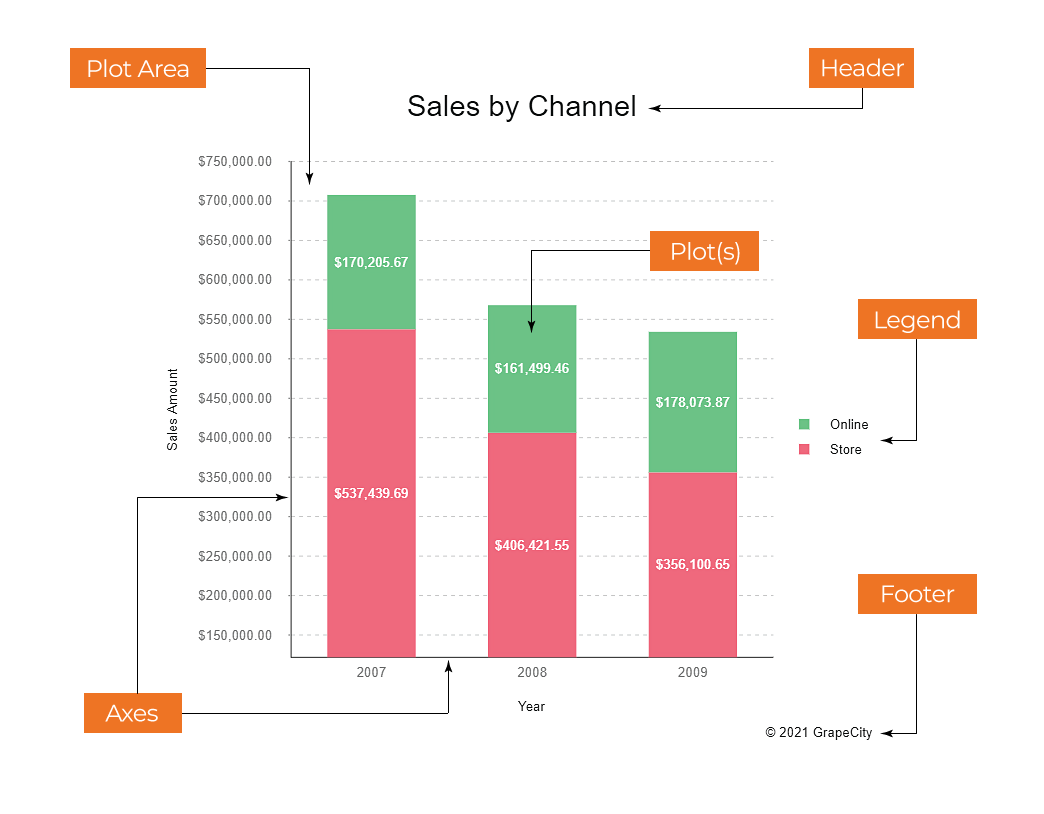
A chart consists of multiple optional parts whose composition and configuration determine chart appearance in the report output. The following diagram depicts typical chart anatomy.


Adding a Chart

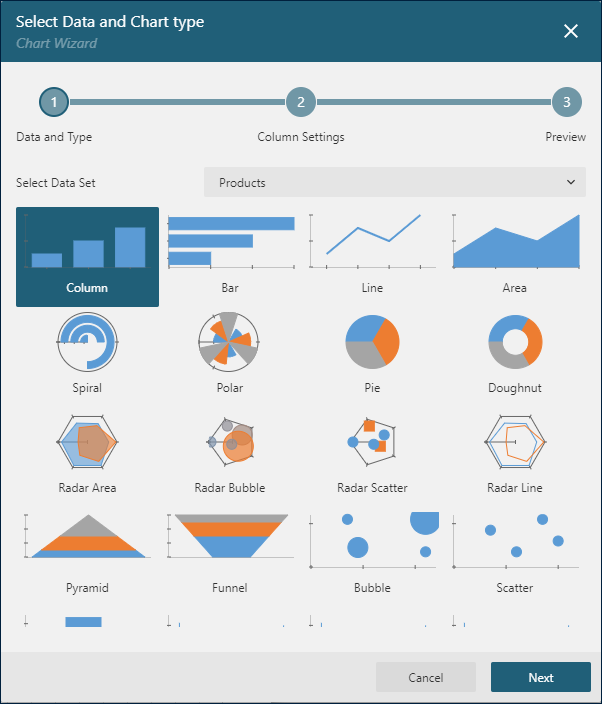
You can add a Chart into a report by either double-clicking on the corresponding item in the toolbox or drag-and-drop it to a report page area. If data binding was set up for the report, the Chart Wizard will appear. It allows you to configure the newly added chart quickly.

On the first page of the Chart Wizard, you can select the dataset to visualize and the plot type.


The first page of Chart Wizard


On the second page of the Chart Wizard, you can configure the chart plot according to the selected plot type.

Refer to the following pages for the details of the configuration for each type.

On the last page of the Chart Wizard, you can select the color palette for the chart, preview the chart output, and finish the configuration. Alternatively, you can choose one of the chart parts, such as the Plot Area, Axes, or Legend by clicking the corresponding button in the Advanced Customization section. The configuration of the selected part will appear in the Properties panel.
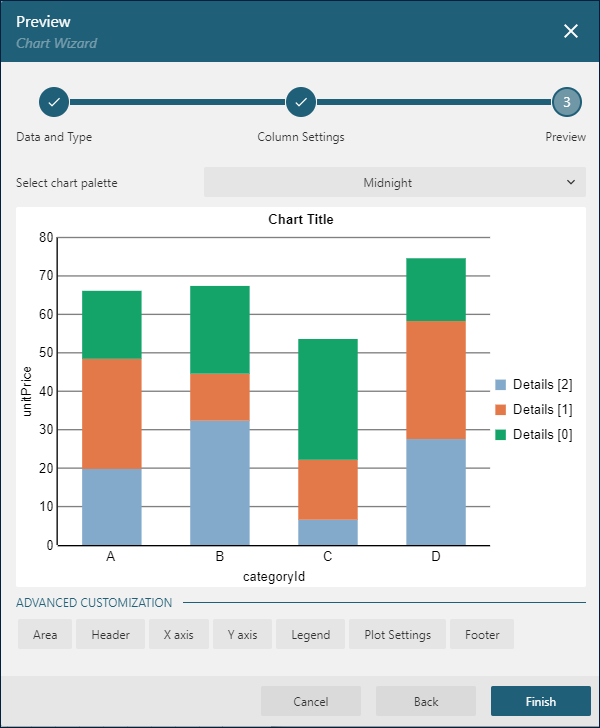

The last page of Chart Wizard

Chart Designer

If you want to modify chart properties further, you can use the report explorer to configure various chart parts, such as plot, axes, or legend. When you select a corresponding node in the explorer, its configuration becomes available in the Properties panel for modification.

General Chart Configuration

If you click the root node of a chart report item, f.e. Chart1, the properties panel loads the general chart configuration. It exposes the Base Report Item properties, Common Style Properties, all the Data Region properties and the following specific properties

  • The Plots is the collection of chart plots.

  • The Palette is the pre-defined or custom collection of colors that plots use to paint shapes

  • The Custom Palette Colors is the use-defined colors collection for the Custom Palette.

Header and Footer items allow you to add a text that appears above and below the containing chart's plot area. Header and footer configuration exposes Common Style Properties, a subset of Text Properties, and the following specific properties.

  • The Caption is the String Expression that determines the text to display in the header or footer

  • The Height The Number in the percentage of the containing chart's height sets the Header or Footer height.

Plot Area

The plot area shows the plotted data and also contains the chart axes and legend. Plot Area configuration exposes Common Style Properties and the collection of axes.

Plot, Axes, and Legend

Use the links below to read about the configuration of other chart parts: