
- GettingStarted
- DeveloperGuide
-
ReportAuthorGuide
- Overview
- Quick Start
- Interface Elements
- Report Controls
-
Data Binding
- Expressions
- Parameters
- Drill Down
- Drill Through
- Hyperlinks
- Sort
- Tutorial 1: Create Tabular Report
- Tutorial 2: Create Parameterized Report
- Tutorial 3: Create Master-Detail Report
- Tutorial 4: Create Pivot Report
- Tutorial 5: Create Report with Chart
- Report Templates
- Tutorial-6-Apply-Styles-and-Themes
- Compatibility-with-AR-NET
Data Binding
Data binding establishes a connection between the report and the data it displays. ActiveReportsJS supports binding to a wide variety of JSON data sources by providing flexible connection configuration at design time and rich API for advanced use-cases. This page discusses concepts fundamental to ActiveReportsJS data binding and provides recipes for several common scenarios.
Data Source
Data Binding in ActiveReportsJS starts with adding a data source. There are two types of data sources:
- Remote JSON - you can use it at design-time to bind a report to various data endpoints such as REST API.
- Embedded JSON - you can use it to keep the data within the report. This approach is useful when you have to supply the data for a report programmatically.
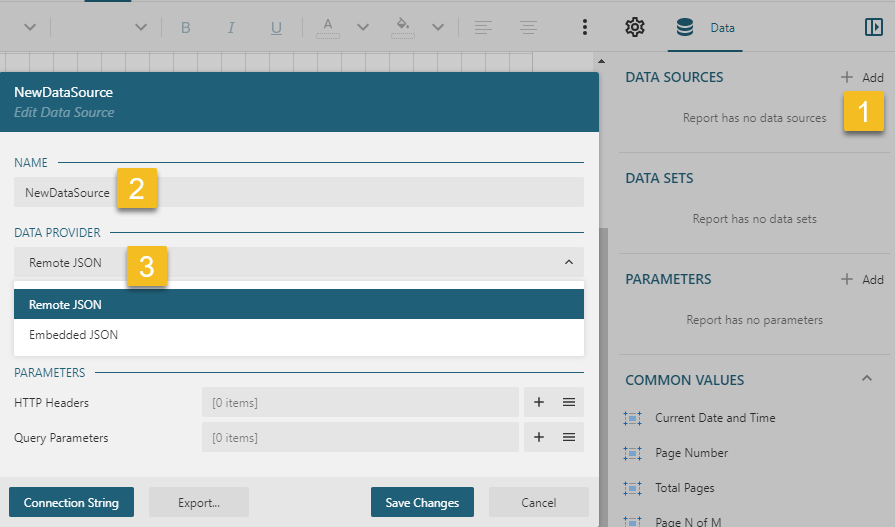
Start the ActiveReportsJS standalone designer application and use the following steps to add a data source and set its type:
- Open the
Datatab of the property inspector on the right side and click theAddbutton. - In the Data Source editor dialog, specify the name of the newly added data source.
- Select one of the two types described above in the
DATA PROVIDERselect box.
Remote JSON data source
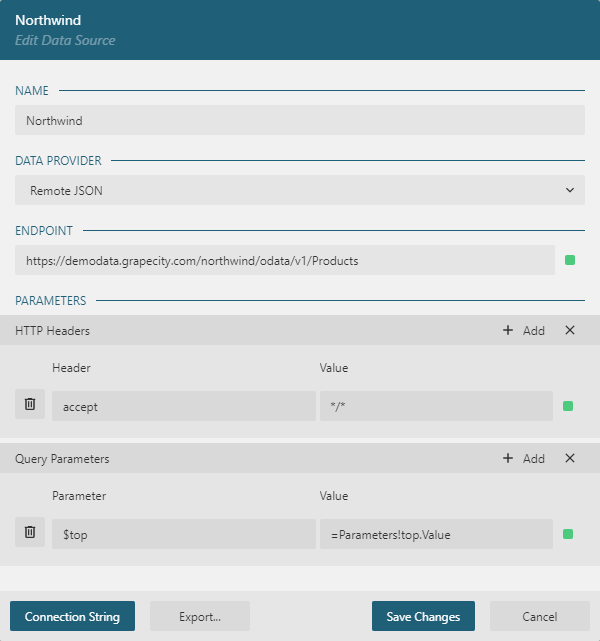
The configuration of the remote JSON data source allows specifying the following properties.
- ENDPOINT - in the most simple case, it is the URL of the data-end point, for example,
https://demodata.grapecity.com/northwind/api/v1/Products. In more advanced scenarios, it could be the base URL to which the endpoint paths are appended by using data sets(they are described further). For example, you can set theENDPOINTtohttps://demodata.grapecity.com/northwind/api/v1that is the base URL for/Products,/Categoriesand other endpoints of the Northwind REST API. Also, theENDPOINTvalue can be empty if you set up the data connection properties within a data set. - HTTP Headers - the collection of HTTP Header fields that are passed along the request. The field's value could be an Expression that evaluates at runtime. For example, you can set the Authorization field to a report parameter value that an application's code fulfills based on the current user. Visit Loading Reports page for more information on setting parameters values at runtime.
- Query Parameters - the collection of (name,value) pairs that define the Query String of the URL. The value of a parameter could be an Expression that evaluates at runtime. For example, you can set the query parameter to a report parameter's value to filter data at runtime.
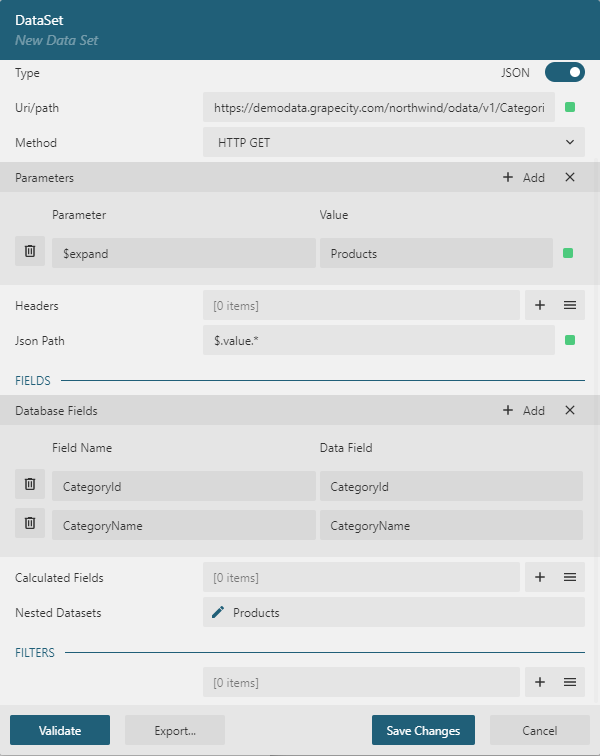
Here is the example of the complete configuration for Northwind Products OData endpoint.
Embedded JSON data source
The configuration for this data source type is the data themselves. If you plan to supply the data runtime, it is still required to specify the dummy data at design-time to let ActiveReportsJS pull the fields list. For example, if you want to feed the Northwind Products list to a report at runtime, you can set the data source like this:
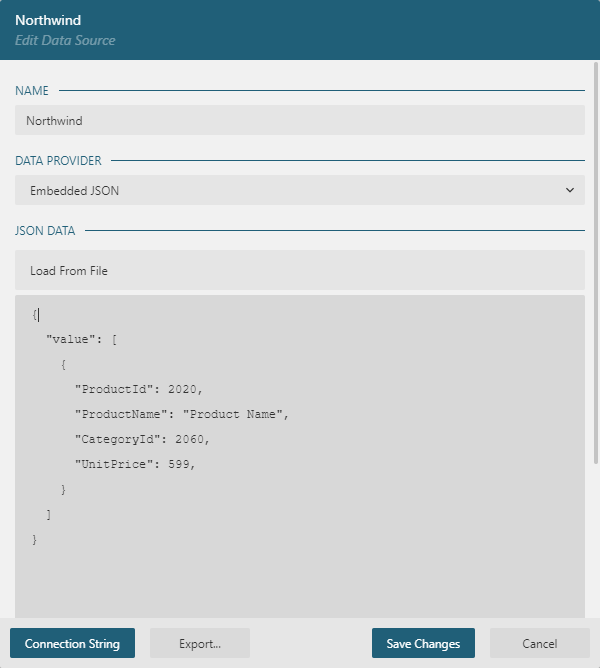
You can load the dummy data from the file or type them manually.
Data Set configuration
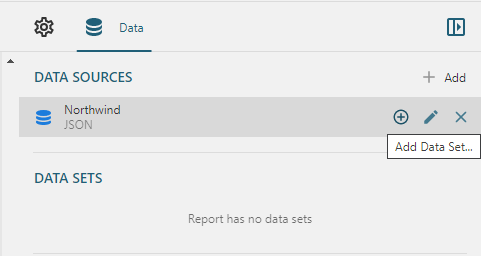
Each data source may contain one or more data sets. Save Changes in the Data Source dialog and click the + icon near the data source name in the Data tab of the property inspector to add the data set.
The configuration of a data set allows specifying the following properties.
- Uri/path - the value depends on the configuration of the parent data source:
- If Data Source's
ENDPOINTis the full URL, likehttps://demodata.grapecity.com/northwind/api/v1/Products, then the data set'sUri/pathshould be empty. - If the Data Source's
ENDPOINTis the base URL, likehttps://demodata.grapecity.com/northwind/api/v1then the data set'sUri/pathshould contain the endpoint path, for example,/Productsor/Categories - If the Data Source's
ENDPOINTis empty, then the data set'sUri/pathshould contain the full URL of the data endpoint. - If the DataSource's type is
Embedded JSON, then the data set'sUri/pathshould be empty.
- If Data Source's
- Method - specifies the request method. Supported methods are
GETandPOST. This property is only applicable to theRemote JSONdata source type. - Post body - specifies the body for a POST request. You can use this property to connect the data set to a GraphQL endpoint. The Post body could be an Expression that evaluates at runtime.
- Parameters and Headers - the purpose of these properties is the same as one of Query Parameters and HTTP Headers properties of the data source. You can set up parameters and headers on the data set level if the
ENDPOINTof the parent data source is the base URL or empty value. These properties are only applicable to theRemote JSONdata source type. - Json Path - JSON data endpoints can retrieve the data of various shapes, and there is no standardized data structure. Hence, it is required to specify the structure using the JSONPath expression. Typically, this expression contains the path to repeated data fragments. For example, the Norwthind Products Data End Point returns the array of Product Objects:
[
    {
        "productId": 1,
        "productName": "Chai",
        ... the rest of properties
    },
    {
        "productId": 2,
        "productName": "Chang",
    },
    ... the rest of the data
]
You can use $.* or $[*] JSONPath expression to specify the repeated data fragments.
The same products list returned by the OData end point looks a bit different:
{
    "@odata.context": "https://demodata.grapecity.com/northwind/odata/v1/$metadata#Products",
    "value": [
        {
            "ProductId": 1,
            "ProductName": "Chai",
            ... the rest of properties
        },
        {
            "ProductId": 2,
            "ProductName": "Chang",
        },
        ... the rest of the data
    ]
}
In that case you can use $.value.* or $.value[*] JSONPath expression to specify the repeated data fragments.
The syntax of JSONPath is quite rich, and you can find more examples on the official page.
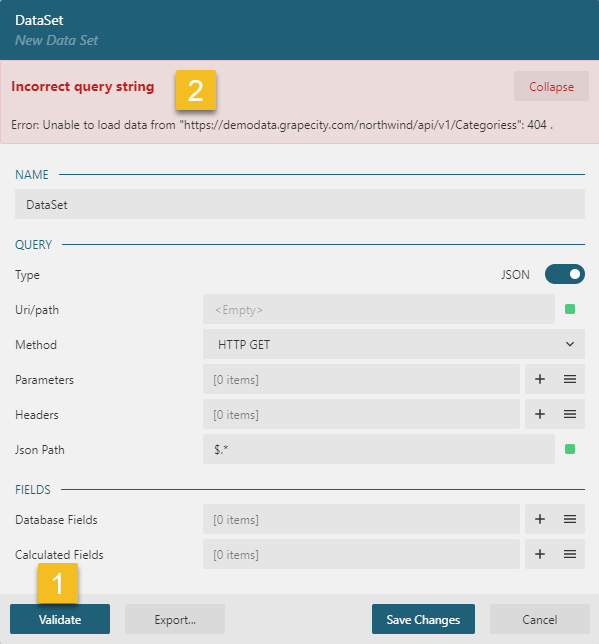
Data Set validation
Once you set up the properties mentioned above, the next step is to validate the data set and retrieve the fields list. In the Data Set dialog, click the Validate button that performs both of these actions. If the configuration is invalid, or there are other issues with a data connection, the dialog shows the error message at the top area:
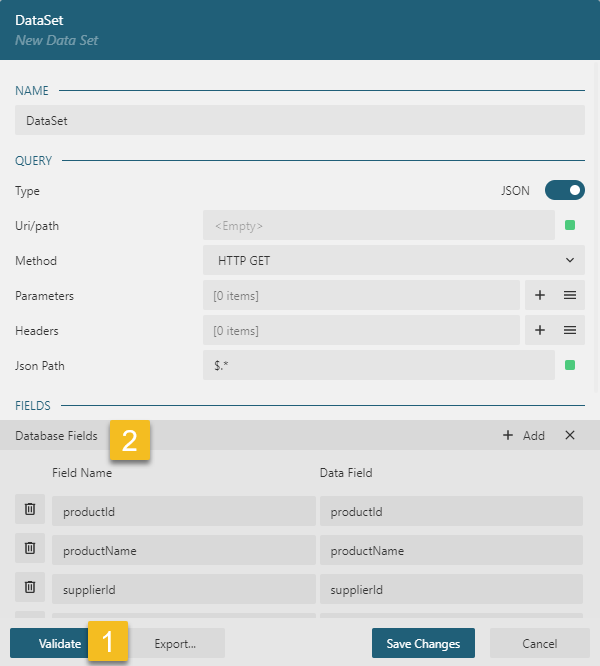
If you set everything correctly, you should see the data fields list - click on the list icon on the right side of the DataBase Fields section to expand the fields list.
Data Set fields
The list of the data set fields consists of DataBase fields and Calculated fields. The former comes from the data themselves; the latter comes from the report author. DataBase fields list lets you perform two common operations:
- Replacing the default
Field Namethat you will use across the report. It could be useful if aData Fieldname is too long or contains special characters. - Specifying the data type and the format for the
Data Field. This feature's most common usage is tagging Date fields because, in JSON data format, dates are usually represented by strings. The syntax for tagging Date isFieldName[Date|Format], for exampleOrderDate[Date|YYYY-MM-DD]. Visit momentjs documentation for the full list of supported format tokens.
To append a calculated field, click on the + icon on the right side of the Calculated Fields section. Set the Field Name that you will use in the report, then set the Value to an Expression. For example, if the database fields list contains UnitPrice, Quantity, and DiscountPerUnit fields for OrderLine entities, then you can add the calculated field called TotalPrice and set its Value to
=(Fields!UnitPrice.Value - Fields!DiscountPerUnit.Value) * Fields!Quantity.Value
The value of the calculated field will be automatically available for each entity of the original data set.
Data Set filters
We recommend filtering the data that the report will display using the data source capabilities itself, for example, by using $filter feature of OData API. It reduces the traffic between an application and the data source and simplifies data processing on the ActiveReportsJS side.
However, after the data set validation described above successfully finishes, you can also set Filters on the dataset level. Click on the + icon on the right side of the Filters section. Set the Expression to point to the field to use for a filter, for example, =Fields!UnitPrice.Value. Then set the Operator to one of the supported filter operators, for instance >. Finally, set the Value of the filter, for example, 1000. In that case, the report will display the data entities with UnitPrice > 1000 only.
Nested Data Set
The JSON data may represent one-to-many relationships between entities. For example, the following request to the OData Northwind endpoint returns the list of categories where each category contains the list of products.
GET https://demodata.grapecity.com/northwind/odata/v1/Categories?$expand=Products
If ActiveReportsJS meets such a structure in the retrieved data, then it automatically creates the data sets hierarchy and displays it in the data set dialog:
Master-detail reports can display such a structure by using nested data regions, visit the Tutorial and check the Live Demo for more information.
Runtime data binding
If, for some reason, you can't set up the data connection at design time and plan to fetch the data at runtime and feed it to a report in the application's code, then you can use the Embedded JSON data source type as described above. Here is the example of code that fetches the data from the Northwind Products endpoint and passes them in the data source properties.
// Use Fetch API to set up the request https://developer.mozilla.org/en-US/docs/Web/API/Fetch_API
const headers = new Headers();
const dataRequest = new Request(
   "https://demodata.grapecity.com/northwind/api/v1/Products",
   {
      headers: headers
   }
);

// fetch the data
const response = await fetch(dataRequest);
const data = await response.json();

// fetch the report definition, it is just a json file
const reportResponse = await fetch("Products.rdlx-json");
const report = await reportResponse.json();

// feed the data to the report
report.DataSources[0].ConnectionProperties.ConnectString = "jsondata=" + JSON.stringify(data);
Then the code could load the report in the viewer or export it to one of the supported formats.
Visit the Live Demo for a code sample.