- GettingStarted
- DeveloperGuide
-
ReportAuthorGuide
- Overview
- Quick Start
- Interface Elements
- Report Controls
- Data Binding
- Expressions
- Parameters
-
Drill Down
- Drill Through
- Hyperlinks
- Sort
- Tutorial 1: Create Tabular Report
- Tutorial 2: Create Parameterized Report
- Tutorial 3: Create Master-Detail Report
- Tutorial 4: Create Pivot Report
- Tutorial 5: Create Report with Chart
- Report Templates
- Tutorial-6-Apply-Styles-and-Themes
- Compatibility-with-AR-NET
Drill Down
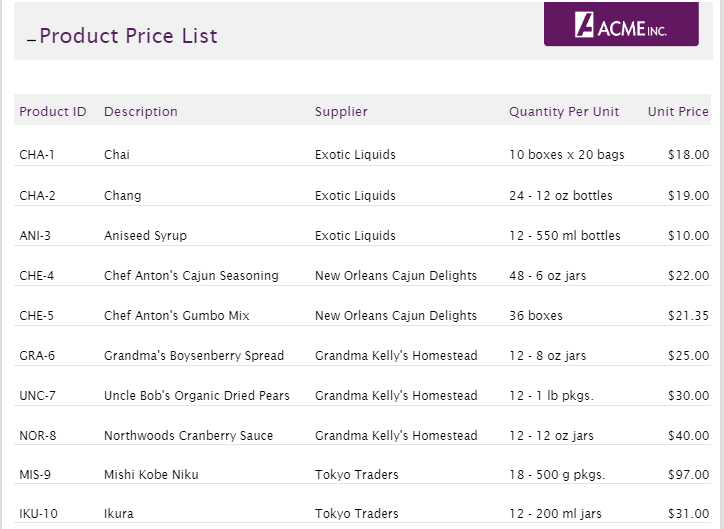
The drill down feature helps in temporarily hiding or collapsing a part of your report. That hidden part can be data regions, report controls, table rows, tablix rows, and column groups, and users can drill down into the data they choose to view. When the report is initially displayed at run-time, the toggle items display with plus sign icons that you can click to display the detail data.
Follow the steps given below to create a drill down report.
Drag and drop a TextBox control in the page header area and a Table data region onto the report design surface.
To populate data in the Table data region, expand your dataset, drag fields you want to add, and drop them inside the details row.
With the Table data region selected on the design surface, go to Properties Mode > Show Advanced Properties.
In the Visibility section of properties:
• set Hidden property to True. This sets the initial visibility of the report control to Hidden.
• set Toggle Item property - select the TextBox (added in step 1) from the drop-down list. This text box will be used to toggle items in the Table to show or hide the data.
On previewing the report, the text box displays an expand or collapse icon to its left.
Click the expand or collapse icon to show or hide the data.