
- GettingStarted
- DeveloperGuide
-
ReportAuthorGuide
- Overview
- Quick Start
- Interface Elements
- Report Controls
- Data Binding
- Expressions
- Parameters
- Drill Down
- Drill Through
- Hyperlinks
- Sort
- Tutorial 1: Create Tabular Report
- Tutorial 2: Create Parameterized Report
- Tutorial 3: Create Master-Detail Report
- Tutorial 4: Create Pivot Report
- Tutorial 5: Create Report with Chart
- Report Templates
- Tutorial-6-Apply-Styles-and-Themes
- Compatibility-with-AR-NET
Banded List
The Banded List is a collection of free-form bands. By default, it is composed of three bands: a header, a footer and a detail band. Bound report controls in the detail band repeat for every row of data. The header and footer rows render once at the beginning and end of the Banded List and are a good place for titles and grand totals.
Some properties of the Banded List control are described below. Note that you need to enable Advanced Properties Mode to view all properties.
Data
Data Set Name: Select a dataset to associate with the banded list. The drop-down list is populated with all of the datasets in the report's dataset collection.
Data Set Parameters: Add data set parameters to filter the data to display in reports at preview.
Filters: You need to provide following values to add a new filter to the collection:
Filter Expression: Enter the expression to use for evaluating whether data should be included in the group.
Operator: Select from the following operators to decide how to compare the expression to the left with the value to the right.
Equal - Only choose data for which the value on the left is equal to the value on the right.
Like - Only choose data for which the value on the left is similar to the value on the right. For more information on using the Like operator, see the MSDN Web site.
NotEqual - Only choose data for which the value on the left is not equal to the value on the right.
GreaterThan - Only choose data for which the value on the left is greater than the value on the right.
GreaterThanOrEqual - Only choose data for which the value on the left is greater than or equal to the value on the right.
LessThan - Only choose data for which the value on the left is less than the value on the right.
LessThanOrEqual - Only choose data for which the value on the left is less than or equal to the value on the right.
TopN - Only choose items from the value on the left which are the top number specified in the value on the right.
BottomN - Only choose items from the value on the left which are the bottom number specified in the value on the right.
TopPercent - Only choose items from the value on the left which are the top percent specified in the value on the right.
BottomPercent - Only choose items from the value on the left which are the bottom percent specified in the value on the right.
In - Only choose items from the value on the left which are in the array of values specified on the right. Selecting this operator enables the Values list at the bottom.
Between - Only choose items from the value on the left which fall between the pair of values you specify on the right. Selecting this operator enables two Value boxes instead of one.
Value: Enter a value to compare with the expression on the left based on the selected operator. For multiple values used with the Between operator, the lower two value boxes are enabled.
Filter Values: When you choose the In operator, you can enter as many values as you need in this list.
Layout
Style: Choose from the list of available styles and set to apply a style to the control.
Page Break: Specify where the page breaks on each instance of the list:
Start - Inserts page break at start of the list.
End - Inserts page break at end of the list.
StartAndEnd - Inserts page break at both start and end of the list.
Prevent Orphaned Header: Indicates whether the orphaned header is displayed on the next page.
Prevent Orphaned Footer: Indicates whether the orphaned footer is displayed on the next page.
New Section: Select to indicate whether this banded list is in its own section with regards to pagination.
Keep Together: Indicates if the data inside the banded list is kept together on a single page if possible.
Consume White Space: Indicates that all white space in the banded list is consumed during report rendering when the banded list’s contents grow rather than preserving the minimum white space between the contents and the bounds of the banded list.
Clicking the banded list reveals the properties for each band - a header, a footer and a detail band.
Header
Repeat On New Page: Repeats the header band on every page when the related details span multiple pages.
Can Grow: Select True to allow the data region to grow vertically to accommodate data.
Can Shrink: Select True to allow the data region to shrink if there is not enough data to fill it.
Page Break: Specify where the page breaks on each instance of the list:
Start - Inserts page break at start of the list.
End - Inserts page break at end of the list.
StartAndEnd - Inserts page break at both start and end of the list.
Keep Together: Select True to have ActiveReportsJS attempt to keep all of the data in the band together on one page.
Details
Layout
Can Grow: Select True to allow the data region to grow vertically to accommodate data.
Can Shrink: Select True to allow the data region to shrink if there is not enough data to fill it.
Page Break: Specify where the page breaks on each instance of the list:
Start - Inserts page break at start of the list.
End - Inserts page break at end of the list.
StartAndEnd - Inserts page break at both start and end of the list.
Keep Together: Select True to have ActiveReportsJS attempt to keep all of the data in the band together on one page.
Footer
Layout
Print At Bottom: Select to have the footer band print at the bottom of the page.
Repeat On New Page: Repeats the footer band on every page when the related details span multiple pages.
Can Grow: Select True to allow the data region to grow vertically to accommodate data.
Can Shrink: Select True to allow the data region to shrink if there is not enough data to fill it.
Page Break: Specify where the page breaks on each instance of the list:
Start - Inserts page break at start of the list.
End - Inserts page break at end of the list.
StartAndEnd - Inserts page break at both start and end of the list.
Keep Together: Select True to have ActiveReportsJS attempt to keep all of the data in the band together on one page.
Group
Name: Enter a name for the group that is unique within the report. You can only use underscore (_) as a special character in the Name field. Other special characters such as period (.), space ( ), forward slash ('/'), back slash (''), exclamation (!), and hyphen (-) are not supported.
Group Expressions: Enter an expression to use for grouping the data. When a detail grouping is set, the value repeats for each distinct result of the grouping expression instead of for each row of data.
Page Break: Specify where the page break occurs relative to grouping on the list:
Start - Inserts page break at start of the list.
End - Inserts page break at end of the list.
StartAndEnd - Inserts page break at both start and end of the list.
Parent: Enter an expression to use as the parent group in case of recursive hierarchies.
Label: Enter an expression to use as a label to represent this item in the table of contents (document map).
New Section: Indicates if the group constitutes its own page numbering section.
Use Case
Let us create a report that displays an invoice with the list of products, displaying the overall subtotal and total values of purchased products at the end of the list.
The final report will be as shown.
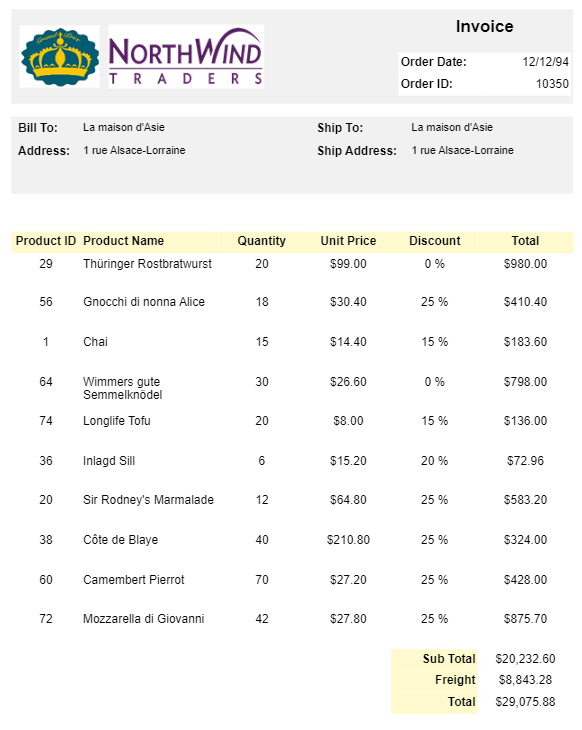
Create a Page Report and drag-drop the Container control onto the design area.
In the Properties tab of the control, set the following properties, like, Width, Height, and Color to some suitable values.
Drag-drop two Image controls into the Container control and place them side by side in the left part of the container. These will be the invoice report logos.
To add information on order date and order ID, add two TextBox controls to the right of the container and bound to the following data set fields, that is,
[OrderDate]and[OrderID].Add three more TextBox controls for displaying the labels, that is, 'Order ID:', 'Order Date:', and 'Invoice'.
To highlight the shipping and billing information, drag-drop another Container control and place it below the first Container control.
Go to the Properties tab of the control and set the following properties, like, Width, Height, and Color to some suitable values.
Drag-drop the following data fields from the dataset on the second Container control:
[Customers_CompanyName],[Address],[ShipName], and[ShipAddress]. Also, add text boxes to add labels to the above data fields: "Bill To:", "Address:", "Ship To:", and "Ship Address:".Drag-drop the Banded List data region on the design area below the second Container control and set its properties to the following values in the Properties tab.
Left: 0in
Top: 2.5in
Width: 6.5in
Height: 1.5in
Fixed Width: 6.5in
Fixed Height: 6.5in
Bind the TextBox controls in the Banded List's Details row to the following data set fields:
[ProductID],[ProductName],[Quantity],[UnitPrice],[Discount], and[ExtendedPrice].In the Header row of the Banded List, set the Value properties of the TextBox controls as follows.
For TextBox1, enter text 'Product ID'
For TextBox2, enter text 'Product Name'
For TextBox3, enter text 'Quantity'
For TextBox4, enter text 'Unit Price'
For TextBox5, enter text 'Value: Discount'
For TextBox6, enter text 'Total'
Drag-drop three TextBox controls to the Footer row of the Banded List, in the extreme right, and set their Value property as follows.
For TextBox1, enter expression
=Sum(Fields!ExtendedPrice.Value)For TextBox2, enter expression
=Sum(Fields!Freight.Value)For TextBox3, enter expression
=Sum(Fields!Freight.Value)
Drag-drop three TextBox controls to the Footer row of the Banded List, to the left of the TextBoxes added in the previous step and set their Value property as follows.
For TextBox1, enter text 'Sub Total'
For TextBox2, enter text 'Freight'
For TextBox3, enter text 'Total'
Right-click the Banded List data region and select Group > Insert Group in the context menu.
Set the Group Expression property to =Fields!OrderID.Value.
Improve the appearance of the controls by resizing the controls and applying font style and alignment properties.
Preview the report.