
- GettingStarted
- DeveloperGuide
-
ReportAuthorGuide
- Overview
- Quick Start
- Interface Elements
- Report Controls
- Data Binding
- Expressions
- Parameters
- Drill Down
- Drill Through
- Hyperlinks
- Sort
- Tutorial 1: Create Tabular Report
- Tutorial 2: Create Parameterized Report
- Tutorial 3: Create Master-Detail Report
- Tutorial 4: Create Pivot Report
- Tutorial 5: Create Report with Chart
- Report Templates
- Tutorial-6-Apply-Styles-and-Themes
- Compatibility-with-AR-NET
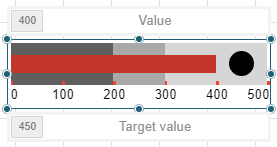
Bullet
Bullet report control is a graph that is a good alternative to using a dashboard for data visualization. It has a pointer that shows a key measure. With this control, you can take a single value, the year-to-date revenue for example, and compare it to a target value that you define in the control's properties.
Some properties of the Bullet control are described below. Note that you need to enable Advanced Properties Mode to view all properties.
Appearance
Label Format: Specify the format for the output values of the labels.
Orientation: Select to display a horizontal or vertical bullet graph.
Show Labels: Turn this property onto display axis labels for the bullet graph.
Data
Best Value: Enter a value or expression to define the highest value on the graph.
Interval: Set the interval at which you want to show tick marks.
Rage 1 Boundary: Enter a value or expression to define the boundary between bad and satisfactory values.
Rage 2 Boundary: Enter a value or expression to define the boundary between satisfactory and good values.
Target Value: Enter an expression to use as the target value of the bullet graph.
Value: Enter an expression to use as the bullet value.
Worst Value: Enter a value or expression to define the lowest value on the graph.
Value Style
Value Color: Select a color to use for the value marker, or select the <Expression...> option to open the Expression Editor and create an expression that evaluates to a color. The default value is Black.
Target Style
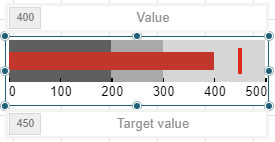
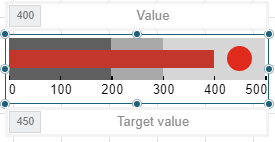
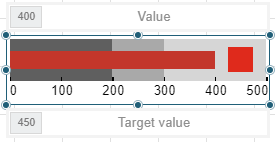
Shape: Choose from Line, Dot, or Square as the shape of the target. The default value is Line.
| Line | Dot | Square |
|---|---|---|
 |
 |
 |
Color: Select a color to use for the border from Color Picker, Standard Colors, or Web Colors.
Line Width: Enter a value in points to set the width of the target value marker. This property applies only when the Shape is set to Line.
Label Style
Font Color: Select a color to use for the label from Color Picker, Standard Colors, or Web Colors.
Font Family: Select the font family name for the label.
Font Style: Apply a font style on the label. Note that if you chose a theme for Layout > Style, the label text appears according to the selected theme. You can select the following styles:
Regular - Makes text appear in normal style.
Bold - Makes text appear bold.
Italic - Makes text appear italicized.
Underline - Makes text appear with a line below the label text.
Strikeout - Makes text appear with a line through the middle of the label text.
Tick Style
Marks: Select the position of marks on the bullet control from None, Inside, and Outside.
| None | Inside | Outside |
|---|---|---|
 |
 |
 |
Color: Select a color to use for the bullet tick from Color Picker, Standard Colors, or Web Colors.
Line Width: Enter a value in points to set the width of the tick line.
Border
Width: Enter a value in points to set the width of the border.
Style: Select a style for the border.
Color: Select a color to use for the border from Color Picker, Standard Colors, or Web Colors.
Use Case
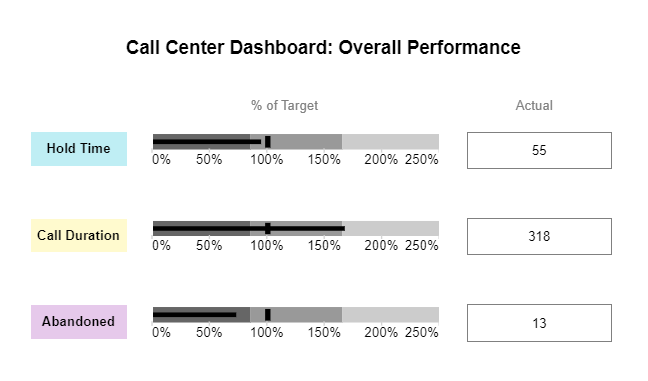
Let’s say that we want to compare the call center overall performance against some target value in percentages. For this, we will use three bullet controls to display the data for the three criteria - call hold time, call duration, and abandoned calls that will indicate when the data is approaching or past a warning range.
For creating such a report, we will place the Bullet controls directly onto the report and set their properties accordingly. We will also use TextBox controls to show the criteria names - [Hold Time], [Call Duration], and [Abandoned]. More TextBox controls with expressions will display the latest actual value for each call center performance criterion.
The final report will be as shown:
Drag-drop the TextBox control onto the designer area and enter the text 'Call Center Dashboard: Overall Performance'. This will be the report's title.
Drag-drop three TextBox controls and place them one below another to show the criteria labels.
Select TextBox2 and enter the text 'Hold Time'
Select TextBox3 and enter the text 'Call Duration'
Select TextBox4 and enter the text 'Abandoned'
Drag-drop the Bullet control next to the textbox containing 'Hold Time' and set the Name property to 'HoldTimeBullet'.
In the Properties tab, set the following properties for the 'HoldTimeBullet':
Label Format: 0%
Best Value: 2.5
Range1 Boundary: .85
Range2 Boundary: 1.65
Target Value: 1
Value:
=Avg(Fields!AvgHoldTime.Value, "CallAverages") / Avg(Fields!TargetHoldTime.Value, "Targets")Worst Value: 0
Drag-drop the Bullet control next to the textbox containing 'Call Duration' and set the Name property to 'CallDurationBullet'.
In the Properties tab, set the following properties for the 'CallDurationBullet':
Label Format: 0%
Best Value: 2.5
Range1 Boundary: .85
Range2 Boundary: 1.65
Target Value: 1
Value:
=Avg(Fields!AvgCallDuration.Value, "CallAverages") / Avg(Fields!TargetDuration.Value, "Targets")Worst Value: 0
Drag-drop the Bullet control next to the textbox containing 'Abandoned' and set the Name property to 'AbandonedBullet'.
In the Properties tab, set the following properties for the 'AbandonedBullet':
Label Format: 0%
Best Value: 2.5
Range1 Boundary: .85
Range2 Boundary: 1.65
Target Value: 1
Value:
=Sum(Fields!Abandonments.Value, "CallAverages") / First(Fields!TargetAbandonments.Value, "Targets")Worst Value: 0
Drag-drop the TextBox control above the bullet controls and set the Value property to
% of Target.Drag-drop the TextBox control next to the 'HoldTimeBullet' and set the Value property to
=Last(Fields!AvgHoldTime.Value, "CallAverages").Drag-drop the TextBox control next to the 'CallDurationBullet' and set the Value property to
=Last(Fields!AvgCallDuration.Value, "CallAverages").Drag-drop the TextBox control next to the 'AbandonedBullet' and set the Value property to
=Last(Fields!Abandonments.Value, "CallAverages").Drag-drop the TextBox control above the last three TextBoxes and enter the text
Actual.Improve the appearance of the report by resizing the controls and applying font style and alignment properties.
Preview the report.