
- GettingStarted
- DeveloperGuide
-
ReportAuthorGuide
- Overview
- Quick Start
- Interface Elements
- Report Controls
- Data Binding
- Expressions
- Parameters
- Drill Down
- Drill Through
- Hyperlinks
- Sort
- Tutorial 1: Create Tabular Report
- Tutorial 2: Create Parameterized Report
- Tutorial 3: Create Master-Detail Report
- Tutorial 4: Create Pivot Report
- Tutorial 5: Create Report with Chart
- Report Templates
- Tutorial-6-Apply-Styles-and-Themes
- Compatibility-with-AR-NET
Chart Elements
In ActiveReportsJS Designer, the Chart data region comprises of several chart elements that can be formatted to generate customized 2-D charts. The following image illustrates the elements that make up the Chart data region:
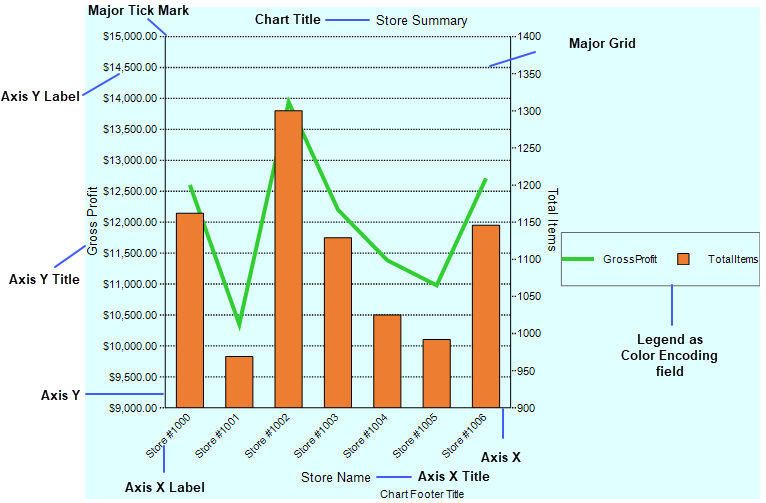
Axis Label: A label along an axis that lets you label the units being shown.
Axis Title: The axis title allows you to provide a title for the information being shown on the axis.
Chart Title: The chart title serves as the title for the chart.
Grid Line: Grid lines can occur on horizontal and vertical axes and normally correlate to the major or minor tick marks for the axes.
Legend: The legend serves as a key to the specific colors or patterns being used to show series values in the chart. To display legends for each plot on a chart, use VALUESNAME as the color field encoding.
Major Tick: Major tick marks are on horizontal and vertical axes and normally correlate to the major gridlines for the axes.
Minor Tick: Minor tick marks are on horizontal and vertical axes and normally correlate to the minor gridlines for the axes.
Plot area: The Plot Area contains data plotted against X-axis and Y-axis.
Data Fields, Category Fields, and Encodings
Encodings convert the data into visual elements. They define how each field from a dataset is visualized.
Data Fields: The values mapping in Data Fields specifies which fields should be plotted along the Y-axis.
Category Field: Category mapping in Category Fields groups the dataset into multiple categories for each unique value.
Encodings: The values mapping in Data Fields specifies which fields should be plotted along the Y-axis.
Details: The details mapping slices the data into sub-divisions that can be clustered or stacked next to each other in the plot.
Color: The color mapping determines which field should be used to determine color assignations for the plot and legend.
Shape: The shape mapping determines which field should be used to determine shape assignations for the plot and legend.
Size: The size mapping determines which field to apply a continuous size-based scale for the plot and legend.