
- GettingStarted
- DeveloperGuide
-
ReportAuthorGuide
- Overview
- Quick Start
- Interface Elements
- Report Controls
- Data Binding
- Expressions
- Parameters
- Drill Down
- Drill Through
- Hyperlinks
- Sort
- Tutorial 1: Create Tabular Report
- Tutorial 2: Create Parameterized Report
- Tutorial 3: Create Master-Detail Report
- Tutorial 4: Create Pivot Report
- Tutorial 5: Create Report with Chart
- Report Templates
- Tutorial-6-Apply-Styles-and-Themes
- Compatibility-with-AR-NET
Line
Line report control is a graphical element that allows you to draw vertical, horizontal, or diagonal lines that visually separate or highlight regions in a report. It has no data associated with it. You can use lines of various color, style, and width.
Some properties of Line control are described below.
Layout
Start Point X: The horizontal coordinate of the line's starting point.
End Point X: The horizontal coordinate of the line's endpoint.
Start Point Y: The vertical coordinate of the line's starting point.
End Point Y: The vertical coordinate of the line's endpoint.
Appearance
Line Color: Select a color to use for the Line control from Color Picker, Standard Colors, or Web Colors.
Line Style: Select a style for the Line control from the list of available styles:
| Solid | Dashed | Dotted | Double |
|---|---|---|---|
 |
 |
 |
 |
Line Width: Enter a value in points to set the width of the Line control.
Use Case
Let’s say that we want to create an order form to be filled out while ordering some goods. This form requires filling the billing and shipping information, and information on the product, its price and quantity to order, as well as the order's subtotals and totals.
Since the information is filled out freely, by hand, or in an electronic form, we don't need to use any datasets. All we need to create the form is a few Line controls to show blank spaces and draw a blank table - to be filled out by hand, and a few TextBox controls to be used as labels for instructions to fill the form. The final report will be as shown:
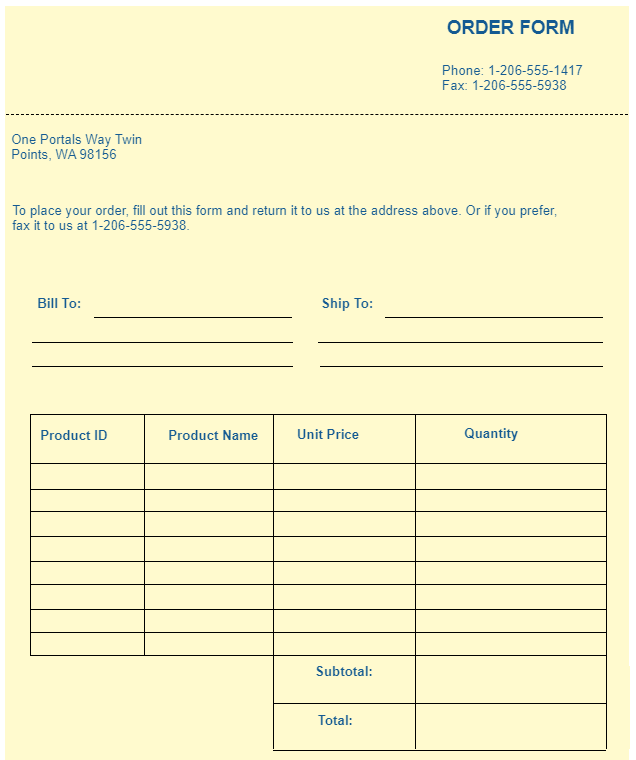
Create a Page Report and drag-drop the TextBox controls to contain default information, for example, the Form name ("Order Form"), address, contact info, instructions, etc.
Drag-drop Line controls to draw horizontal lines that will show blank space that need to be filled for the "Bill To:" and "Ship To:" information.
Draw the table using Line controls. Drag-drop the Line controls one by one and draw the lines in horizontal and vertical directions.
- To draw a perfect vertical line, the value of 'Start Point X' and 'End Point X' should be equal. Similarly, to draw a perfect horizontal line, the value of 'Start Point Y' and 'End Point Y' should be equal.
- For precise alignments of several lines, use Snap to Grid and Snap to Guides options at the bottom of the designer.
Drag-drop the TextBox controls to provide labels for table columns: "Product ID", "Product Name", "Unit Price", and "Quantity".
Drag-drop the TextBox controls to provide labels for the "Subtotal:" and "Total:".
Improve the appearance of the report by adjusting the properties of the report controls used.
Preview.