- GettingStarted
- DeveloperGuide
-
ReportAuthorGuide
- Overview
- Quick Start
- Interface Elements
- Report Controls
- Data Binding
- Expressions
- Parameters
- Drill Down
- Drill Through
- Hyperlinks
- Sort
- Tutorial 1: Create Tabular Report
- Tutorial 2: Create Parameterized Report
- Tutorial 3: Create Master-Detail Report
- Tutorial 4: Create Pivot Report
- Tutorial 5: Create Report with Chart
- Report Templates
- Tutorial-6-Apply-Styles-and-Themes
- Compatibility-with-AR-NET
Table
The Table data region consists of rows and columns that organize data. You can add data in a table either by dragging and dropping fields from the dataset or by using ellipsis ![]() available in every table cell (text box). When you add data in a cell in the detail row, a label is automatically added for the table header.
available in every table cell (text box). When you add data in a cell in the detail row, a label is automatically added for the table header.
Layout
Rows
Drag and drop Table data region onto the design area of the report. By default, you have a table with three rows and three columns, a total of nine cells, each of which is a text box.
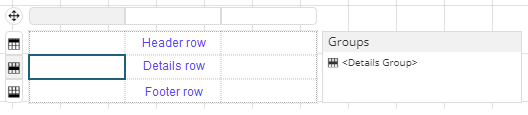
Header row: When you drag a field into a cell in the details row, the header row above the details row is automatically filled with labels. You can choose to repeat the header on each page of the report in the table.
Details row: The table data is displayed on details row. Drag-drop the fields onto the details row from the data set or select the data from the ellipses on each cell. This binds the data to the table and the Data Set Name property of the table is automatically set. The Details row repeats for every data value in the data source. When you have Details Group, each details row is inside the detail group.
Footer row: Footer row appears below the details row. It is used to display table aggregates such as count, total, etc. You can choose to repeat the footer on each page of the report in the table.
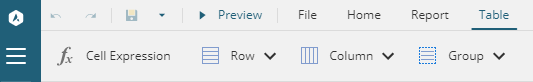
At design time, you can add or remove columns, rows, and groupings to suit your needs - from the Table tab that appears on the designer Ribbon, or from the row and column handles.
Right-click a cell and choose to insert rows, columns, groups, or enter a cell expression. To add more columns to the table, click inside the table to display the column handle, and then click the plus sign.
To remove any of the rows - select the row, right-click, and select Remove. You can also right-click on the row handle and select Remove Header, Remove Details, Remove Footer, to remove the desired row or a group.
You can also embed other data regions in table cells.
Cells
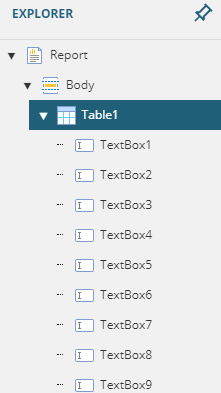
Table cells are the TextBox controls at rows and columns intersection. The function of each cell depends on its place in the table: header, details, or footer row.
You can select a cell by clicking inside the table or clicking the textbox from the Report Explorer.
To select multiple cells, press the SHIFT or CTRL key, and click the cells. You can resize multiple cells and set common properties, or apply merge on the selected cells. Use 'Ctrl + A' to select all cells in the table.
Expressions in Table Cells
As with all report controls, you can use expressions to further manipulate the data within the cells of the table. On previewing a report, the expressions retrieve, evaluate, and display data in each cell of the table. You can also use operators or functions in a complex expression to calculate aggregate values. Expressions can also be used for filtering and sorting data. See Expressions for more information.
Add Groups
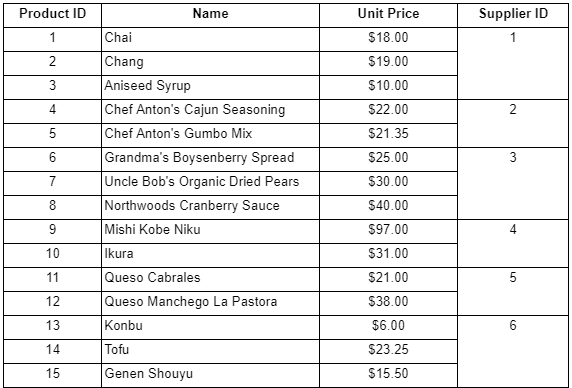
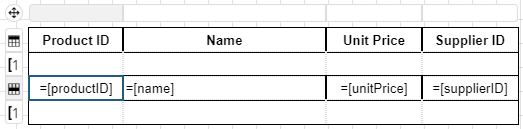
Let us assume that we have a report that displays Product details in a Table data region – Product ID, Name, Unit Price, and Supplier ID fields, similar to the following. 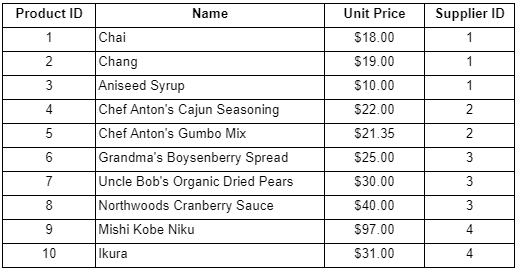
Use the following steps to group table details by category id.
Right-click any text box (cell) in the details row of the table to view options in the context menu.
Go to Group and select Insert Group. This adds a row group above and below the details row.
In the first text box of the added row group, we will display CategoryID field. Note that the table groups are also displayed in the adorner on the right side of the Table data region.
From the adorner on the right side of the table, select the Table1_Group1 row group and go to the Properties pane.
In the Group Expressions property, click Show Items and then select Add Item.
Click the radio button to display the fields and select the CategoryID field.
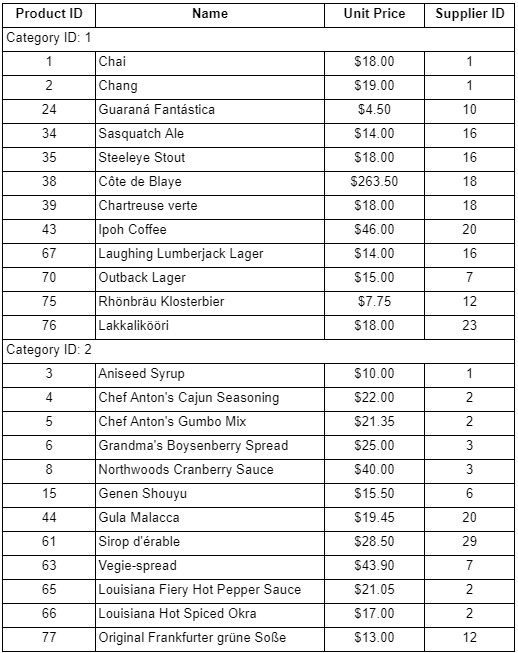
After you complete the above steps, you will have a report that looks similar to the following.
Merge Cells
Data in table cells can be merged using Auto Merge Mode property which provides three options - Never, Always, and Restricted. The detail cells with same data values and with Auto Merge Mode property set to:
Never: are not merged.
Always: are merged.
Restricted: are merged only if the corresponding cells in previous columns are similarly merged.
If for example, cells in Column 2 (with same data values) are set 'Restricted' and the corresponding cells (with same data values) in the previous column (Column 1) are set 'Never', then cells in Column 2 are not merged.
Let us assume that we have a report that displays Product details in a Table data region – Product ID, Name, Unit Price, and Supplier ID fields, similar to the following.
Use the following steps to merge the cells in the Table data region with similar supplier ids.
Select the SupplierID textbox in the details row.
Go to the Properties pane and set Auto Merge Mode property to Always. This merges the cells in the Supplier ID column with similar supplier ids.
After you complete the above steps, you will have a report that looks similar to the following.