- GettingStarted
- DeveloperGuide
-
ReportAuthorGuide
- Overview
- Quick Start
- Interface Elements
- Report Controls
- Data Binding
- Expressions
- Parameters
- Drill Down
- Drill Through
- Hyperlinks
- Sort
- Tutorial 1: Create Tabular Report
- Tutorial 2: Create Parameterized Report
- Tutorial 3: Create Master-Detail Report
- Tutorial 4: Create Pivot Report
- Tutorial 5: Create Report with Chart
- Report Templates
- Tutorial-6-Apply-Styles-and-Themes
- Compatibility-with-AR-NET
Tablix
A Tablix data region displays detailed or grouped data in cells arranged into rows and columns.
Tablix has mainly four areas: the body, the row group, the column group, and the corner. The Tablix Wizard is used to populate the data in these areas of the tablix.
Using the Tablix Wizard
Add a dataset for the Tablix.
Drag and drop the Tablix data region onto the design surface. The Tablix Wizard will open automatically. You can also open the wizard later, if the tablix structure is not complex, by clicking the gear
 sign.
sign.Drag-drop the fields available in the dataset to:
• Rows: row group that expands downward.
• Columns: column group that expands across the page.
• Values: data where rows and columns intersect, which makes the body area. You can also modify the aggregate and format of the added value.
Set the layout of the Tablix:
• Total: to show totals or subtotals for the groups.
• Styling: to apply styles on Tablix.
• Organization:
◦ Set Expand and Collapse for Groups: display plus sign to expand and minus sign to collapse.
◦ Add Frozen rows and columns: set rows or columns to freeze. This is useful in case a data region contains a large amount of data (in an RDL report)and the user must scroll to see all of the data. On scrolling the column or row headers out of sight, the data becomes difficult to understand.
Add Groups
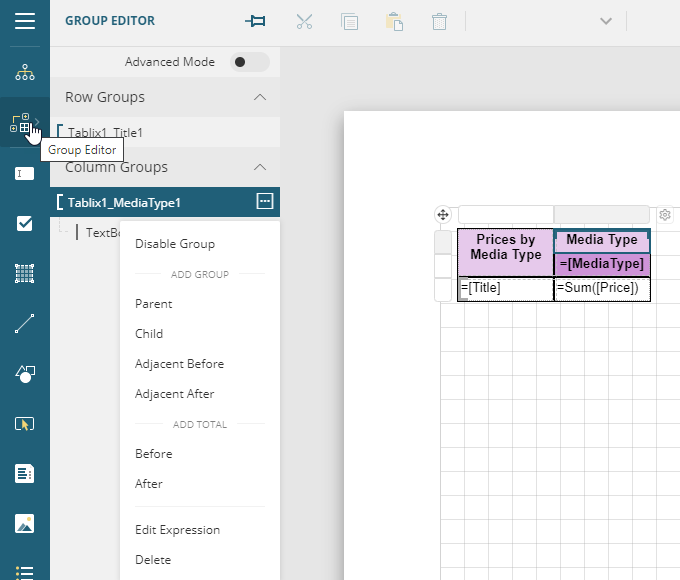
Let's see how groups are added in a report with the Tablix data region. The Group Editor is specifically designed to manage the tablix structure.
The group expressions of the added groups can be viewed in the properties pane by selecting the row or column group from the Group Editor, or from the tablix itself.
To open the Group Editor, select the Tablix on the Design surface, then Group Editor in the left pane of the Designer.
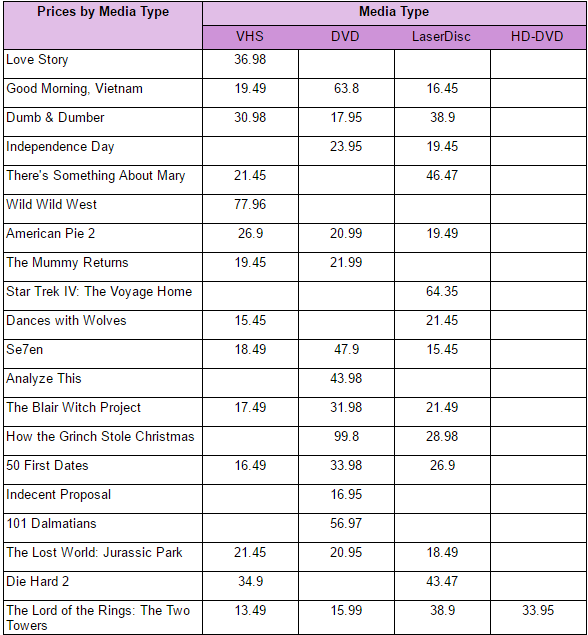
Let's add groups in the report with Tablix data region as shown:
Add an adjacent group
Right-click the MediaType column group area to view options in the context menu.
Go to Column Group and select Adjacent After.
Drag and drop the SaleDate field on the added adjacent group.
Add a Child Group
Right-click the MediaType column group area to view options in the context menu.
Go to Column Group and select Child.
Drag and drop the Country field on the child group area.
To display the aggregate price for the sale dates,
Drag and drop the Price field onto the body of the tablix.
Go to Properties and change the Value to
=Sum(Fields!Price.Value).
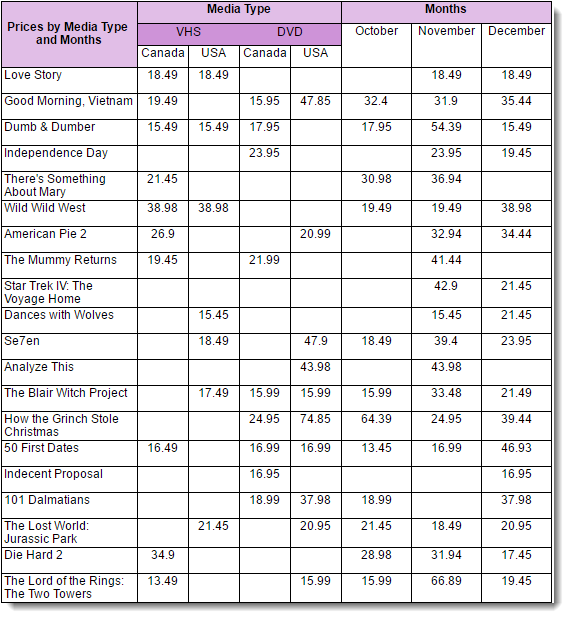
Add Filters
You may need to add filters on the data or apply grouping and sorting in order to organize data.
Let's see how to use filters to limit the horizontal data for MediaType column group in the above tablix.
Add filter to MediaType column group so it displays only two types of media - VHS and DVD.
Select MediaType column group and from the Tablix Member tab, go to Filters.
Click Show Items and select Add Item.
Click the icon on the right to display the filter properties.
Click the radio button next to Filter Expression to display the fields and select the MediaType field.
Click the drop-down next to Operator and select 'In'.
Click Show Items to open Filter Values.
Click Add Items and enter text 'VHS'.
Click Add Items again and enter 'DVD'.
To display dates in the order of occurrence,
Go to Sort Expressions property, click Show Items, and then click Add Item.
Enter the expression
=Fields!SaleDate.Value. Set the sort order to ascending (default).
Merge Cells
Data in tablix cells can be merged using Auto Merge Mode property which provides three options - Never, Always, and Restricted. The cells in the row groups with same data values and with Auto Merge Mode property set to:
Never: are not merged.
Always: are merged.
Restricted: are merged only if the corresponding cells in the previous columns are similarly merged.
If for example, cells in Column 2 (with same data values) are set 'Restricted' and the corresponding cells (with same data values) in previous column (Column 1) are set 'Never', then cells in Column 2 are not merged.
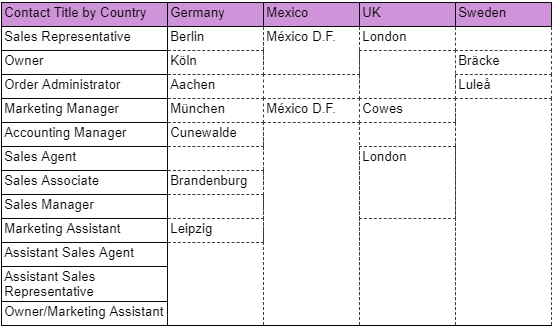
Let us assume that we have a report with the Tablix data region, similar to the following.
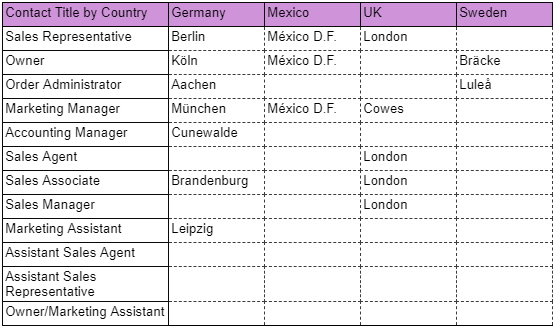
Use the following steps to merge the cells in the Tablix data region with similar cities.
Select the City textbox in the row group.
Go to the Properties pane and set Auto Merge Mode property to Always. This merges the cells in the row group with similar cities.
After you complete the above steps, you will have a report that looks similar to the following.