
- GettingStarted
- DeveloperGuide
-
ReportAuthorGuide
- Overview
- Quick Start
- Interface Elements
- Report Controls
- Data Binding
- Expressions
- Parameters
- Drill Down
- Drill Through
- Hyperlinks
- Sort
-
Tutorial 1: Create Tabular Report
- Tutorial 2: Create Parameterized Report
- Tutorial 3: Create Master-Detail Report
- Tutorial 4: Create Pivot Report
- Tutorial 5: Create Report with Chart
- Report Templates
- Tutorial-6-Apply-Styles-and-Themes
- Compatibility-with-AR-NET
Tutorial 1: Create Tabular Report
In tabular reports, the data is organized along the rows and columns of a Table data region. The data in the form of fields and entities is fetched from the data set added to the report.
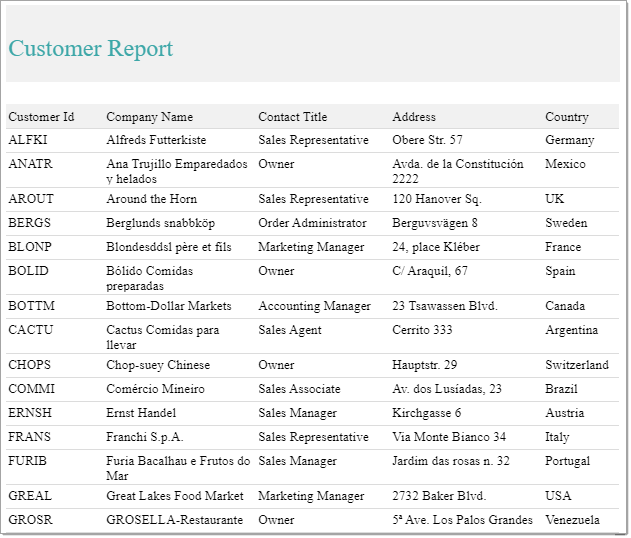
This tutorial guides you through the steps to create a tabular report.
After you complete this tutorial, you will have a report that looks similar to the following.
Bind Data to Report
Create a new report. By default you have a blank RDL Report.
Connect to a data source.
Go to Data tab and click Add.
In the DataSource dialog, provide the following URL as Endpoint for the Remote JSON provider:
https://demodata.grapecity.com/northwind/api/v1/CustomersAdd a dataset.
Click Add Data Set for the added data source.
In the DataSet dialog, enter the Json Path:
$.[*].
See Databinding for information on connecting to data sources and adding datasets.
Create Data-bound Table
Expand the dataset fields and enable Select Fields...
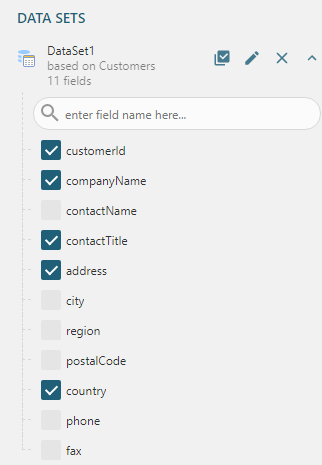
Select the required fields and drag-drop onto the design area.
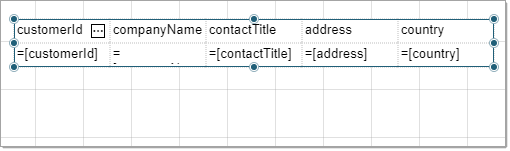
A table with its columns bound to the fields is created. The Header row above the details row is automatically filled with labels.
Alternatively, you can first drag-drop the Table data region  onto the design area of the report and then drag-drop fields onto the details row.
Sort Table Data
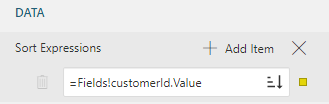
Apply sort on any field in the table data in ascending or descending order. Let us sort our table data by customerID field in descending order.
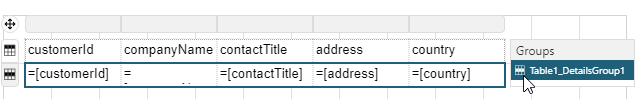
From the adorner on the right side of the table, select <Details Group> and go to the Sort Expressions property.
Click Show Items and then select Add Item.
Click the radio button to display the fields and select the customerID field to sort the table by price.
Note: You can also enter a sort expression in the Expression Editor: Data - Sort Expressions dialog by selecting Expression...Click descending
 icon to sort the customerID field in descending order. You can change the sort order to ascending by clicking the ascending
  icon.
icon.
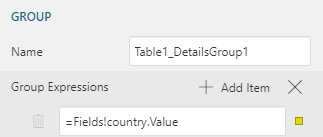
Group Table Data
You can organize the table data in groups to add more meaning to the table. Let us group the table w.r.t. country field such that our table displays unique country values.
From the adorner on the right side of the Table data region, select <Details Group>, and go to the Properties pane.
In the Group Expressions property, click Show Items and then select Add Item.
Click the radio button to display the fields and select the Title field.
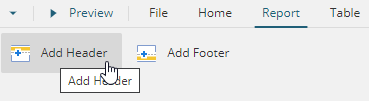
Add Page Header
Go to the Report tab on top of the designer and select Add Header option.
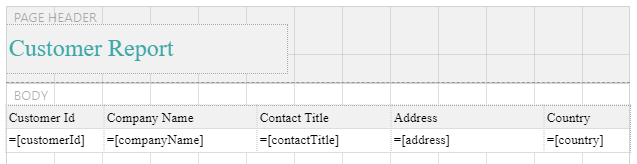
Drag and drop a TextBox control
 in the header area.
Click inside the text box and enter the text 'Customer Report'.
Customize the Appearance of Report
Note: You may need to resize and reposition the controls on the report to accommodate data, and for a cleaner look.
To customize the Page Header, set the BACKGROUND - Color property to '#f1f1f1'.
Select the text box containing the text 'Customer Report' and set the following properties.
Property Value TEXT - Color #3da7a8 TEXT - Font Size 16pt TEXT - Text Align Left TEXT - Vertical Align Middle To customize Header row of the table, set the following properties for all text boxes in the row.
Property Value BORDER - Width 0.25pt BORDER - Style Solid BORDER - Color Gainsboro TEXT - Text Align Left TEXT - Vertical Align Middle Similarly, customize the text boxes in the Details row of the table.
Preview and Save Report
Click Preview to view the final output of your report.
Exit the preview mode by clicking Back on the left side of the designer.
Click Save to open the Save dialog box. Enter the report name and click Save Report.