
- GettingStarted
- DeveloperGuide
-
ReportAuthorGuide
- Overview
- Quick Start
- Interface Elements
- Report Controls
- Data Binding
- Expressions
- Parameters
- Drill Down
- Drill Through
- Hyperlinks
- Sort
- Tutorial 1: Create Tabular Report
- Tutorial 2: Create Parameterized Report
- Tutorial 3: Create Master-Detail Report
- Tutorial 4: Create Pivot Report
- Tutorial 5: Create Report with Chart
- Report Templates
- Tutorial-6-Apply-Styles-and-Themes
- Compatibility-with-AR-NET
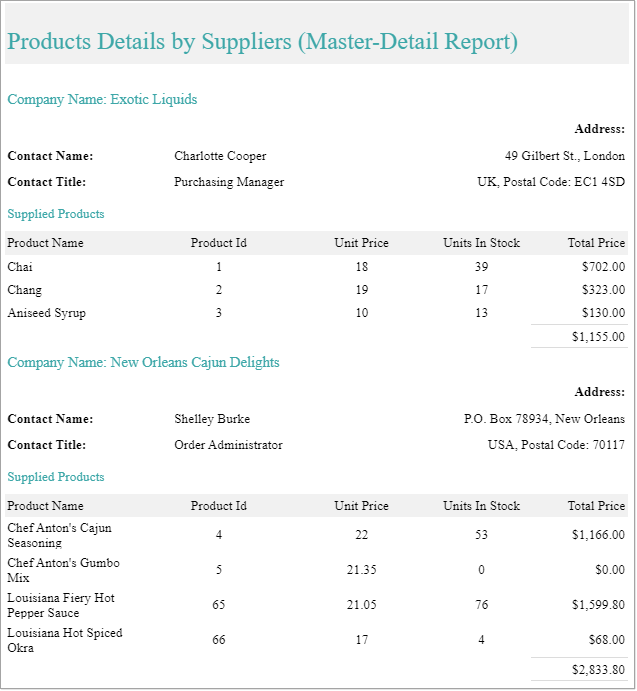
Master-Detail Report using Nested Data Regions (with multiple datasets)
A master-detail report displays data such that for each master record, the associated details are repeated. Such a report can be created by using nested data regions where each data region fetches the data from different datasets.
Now, to display data in nested data regions that are bound to different data, there should be a common field in the datasets to establish the master-detail (parent-child) relationship. This field is used to filter data in the child data region based on the values passed from the parent data region.
In this tutorial, we will use two nested Table data regions bound to two different datasets: Suppliers and Products. The SupplierId is the common field in both the datasets, which will also act as a filter for the child table.
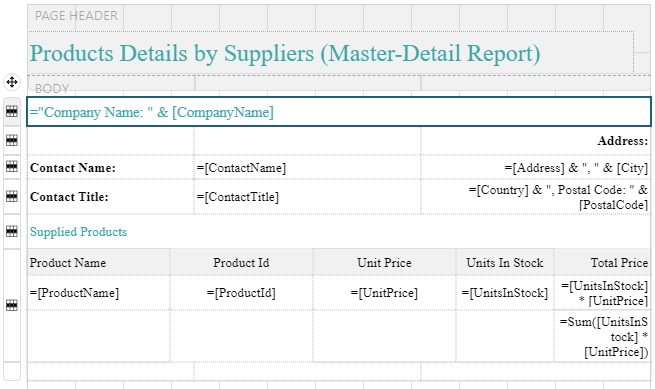
After you complete this tutorial, you will have a report that looks similar to the following.
Bind Data to Report
Create a new report. By default, you have a blank RDL Report.
Connect to a data source.
Go to the Data tab and click Add.
In the DataSource dialog, provide the following URL as Endpoint for the 'Remote JSON' provider:
https://demodata.grapecity.com/northwind/api/v1/- Click Save Changes.
Add datasets.
Dataset_Suppliers:Click Add Data Set against the added data source.
In the DataSet dialog > Uri/Path, write the resource name as 'Suppliers'.
Enter the Json Path:
$.value[*].Validate the query to retrieve fields and Save Changes.
Dataset_Products:
Similarly, add another dataset for the same data source endpoint.In the DataSet dialog > Uri/Path, write the resource name as 'Products'.
Enter the Json Path:
$.value[*].Validate the query to retrieve fields and Save Changes.
See Databinding for information on connecting to data sources and adding datasets.
Create the Parent (Master) Table
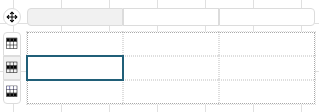
Drag-drop a Table data region (Table1) from the Toolbox to the design area.
With Table1 selected, set the Data Set Name property to 'DataSet_Suppliers'.
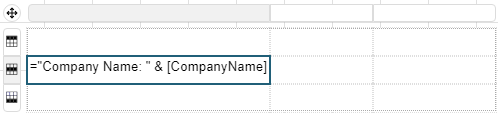
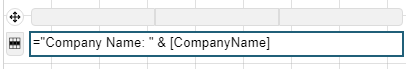
In the first cell in the Details row, enter the following expression:
="Company Name: " & Fields!CompanyName.Value
From the table, remove the header and footer.
Merge cells across the Details row to span the Company Name across the row.
This will be the title for the parent table containing the suppliers' information.With the above row selected, click the plus sign (+) in the Row handle to add more Details rows. We need three such rows, as explained in the steps below, to display more information about the supplier.
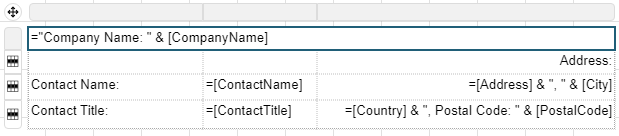
- The first row to display the text 'Address:'.
- The second row to display the [ContactName], [Address], and [City].
- The third row to display the [ContactTitle], [Country], and [PostalCode]
Create the Child (Detail) Table
In the parent table, Table1, add two new Details rows below the previously added rows.
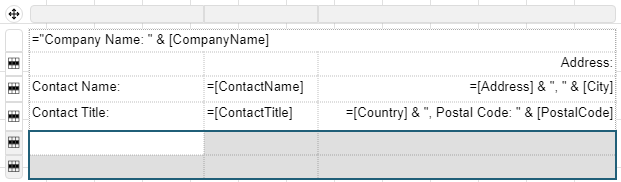
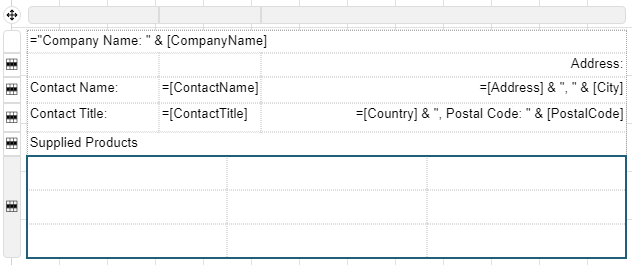
These rows will contain information about products for each supplier, as described in the steps below.Merge the cells in the first row and enter the title for the child table, 'Supplied Products'.
Merge the cells in the second row. It is this row, which will contain the child table.
Drag-drop the Table data region (Table2) from the toolbox inside the row added in the previous step. Now the parent table row contains the child table.
Select Table2 and set the Data Set Name property to 'DataSet_Products'.
Expand the dataset fields and populate the fields in the table as shown.
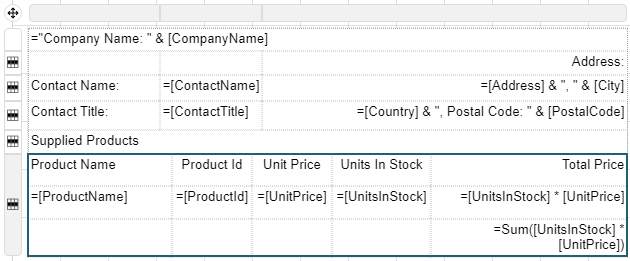
- Note that we have added more columns in the table to show 'UnitsInStock' and 'Total Price' for each product.
- The Header row for the table is automatically filled with labels for the dataset fields.
- The Footer row of the table displays the sum of the total prices for the products supplied using expression=Sum(Fields!UnitsInStock.Value * Fields!UnitPrice.Value).
The product details are now repeated for each master record (supplier). But we need to add a filter on the child data using the common field in the nested tables (SupplierId) so that for each supplier, the product details for only that supplier are displayed.
Add a Filter in the Child Table
Select the child table (Table2) and go to the Properties pane.
In the Filters property, go to Show Items, and select Add Item.
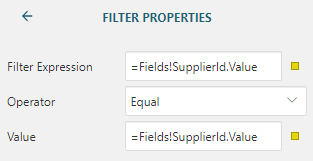
Click Filter Properties Icon
 to display the filter properties.
Click the radio button next to Filter Expression and select 'SupplierId'.
From the drop-down next to Operator, select 'Equal'.
Click the radio button next to Value and select 'SupplierId'.
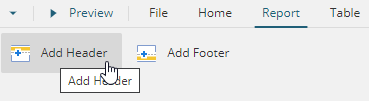
Add Page Header
Go to the Report tab on top of the designer and select Add Header option.
Drag and drop a TextBox control
 in the header area.
Click inside the text box and enter the text 'Products Details by Suppliers (Master-Detail Report)'.
Customize the Appearance of Report
Note: You may need to resize and reposition the controls on the report to accommodate data, and for a cleaner look.
Set the text alignments using TEXT - Text Align (Left, Right, Center, etc.) and TEXT - Vertical Text Align (Top, Middle, or Bottom) properties.
Set a background color for Page Header (#f1f1f1).
Set a font using the TEXT - Font Family property (Song).
Set the color for the text in page header and the titles for the parent (master) and child (detail) tables of the report using TEXT - Color property (#3da7a8).
Set the TEXT - Font Size for the textbox in page header (16pt) and the textboxes in the table (8pt).
Set the border properties for the textboxes in the table - Border - Width (0.25pt), Border - Style, and Border - Color (Gainsboro).
Set the display format for the currency in price fields - select the textboxes containing the price fields and set TEXT - Format to 'Currency'.
Preview and Save Report
Click Preview to view your report in the final output.
Exit the preview mode by clicking Back on the top left side of the designer.
Click Save to open the Save dialog box. Enter the report name and click Save Report.