
- GettingStarted
- DeveloperGuide
-
ReportAuthorGuide
- Overview
- Quick Start
- Interface Elements
- Report Controls
- Data Binding
- Expressions
- Parameters
- Drill Down
- Drill Through
- Hyperlinks
- Sort
- Tutorial 1: Create Tabular Report
- Tutorial 2: Create Parameterized Report
- Tutorial 3: Create Master-Detail Report
- Tutorial 4: Create Pivot Report
- Tutorial 5: Create Report with Chart
- Report Templates
- Tutorial-6-Apply-Styles-and-Themes
- Compatibility-with-AR-NET
Complex Pivot Report
A complex pivot report contains a tablix with additional adjacent rows/columns or parent or child row/column groups to represent summary values of the numerical data.
This tutorial guides you through the steps to create a complex pivot report by adding column and row groups to the tablix created in Simple Pivot Report.
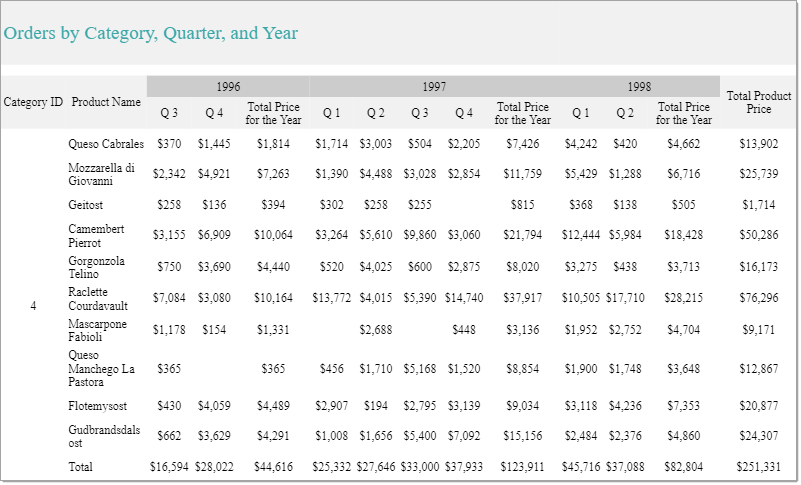
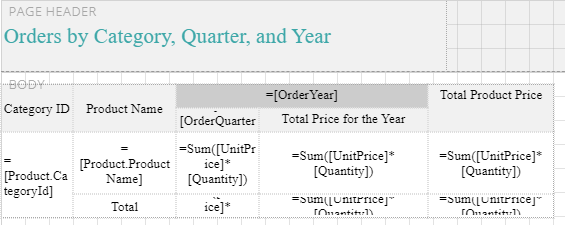
After you complete this tutorial, you will have a report that looks similar to the following.
Add Row and Column Groups
Let us add row and column groups to the existing simple pivot report. We will add a child group 'OrderQuarter' to the OrderYear column group to display total prices for each quarter of a year. Similarly, we will add a parent group 'Product.CategoryId' to Product.ProductName row group to show product categories and group product names under the product categories.
To add a child group (OrderQuarter),
Right-click the 'OrderYear' column group area to view options in the context menu.
Go to Column Group and select Child.
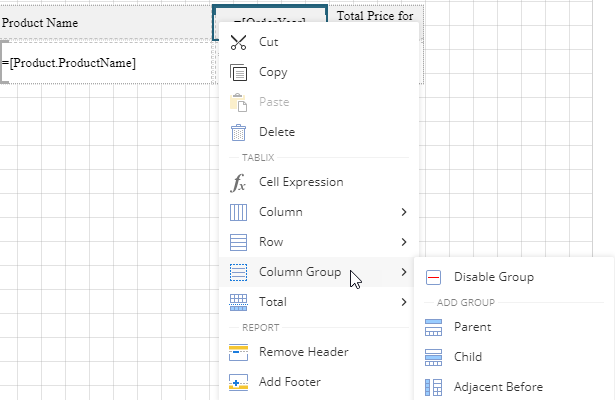
With the child group selected, go to the Properties pane > Tablix Member.
In the Group Expressions property, go to Show Items.
Click the radio button next to Group Expressions and select 'OrderQuarter'.
Now, switch the tab to TextBox properties and enter Value as
="Q " & Fields!OrderQuarter.Value.
To add a parent group (CategoryId),
Right-click the 'Product.ProductName' row group area to add a parent group from the context menu.
Go to Row Group and select Parent.
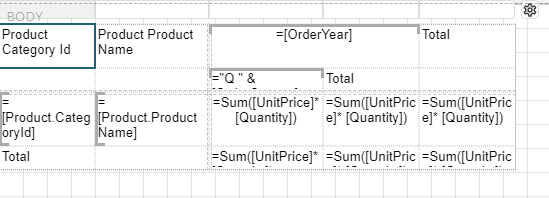
Now, the tablix looks similar to the following.
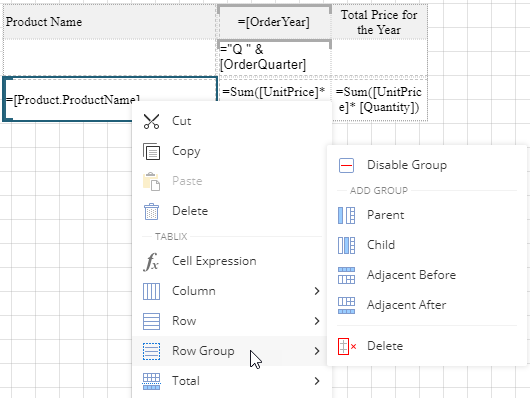
With the parent group selected, go to the Properties pane > Tablix Member.
In the Group Expressions property, go to Show Items and select Add Item.
Click the radio button next to Group Expressions and select 'Product.CategoryId'.
Now, switch the tab to TextBox properties and enter Value as
=Fields.Item("Product.CategoryId").Value.
Add Totals to the Groups
We will add a totals row to display the sum for each category id and a subtotal column to display the total price for the order year.
Click the Open Tablix Wizard icon
 corresponding to the tablix data region.
Under the Totals area in the Layout Design, check the Totals for Rows and Sub Totals for Columns.
Click OK to save the changes. You will observe that your tablix would now look like the following.
Note that on adding totals, the labels for the data fields in the Tablix data region are renamed, which we will rename in the next steps.
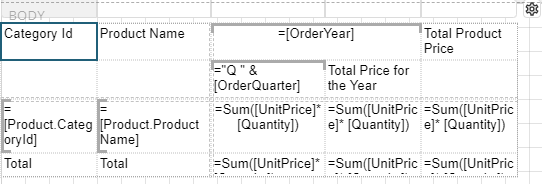
Add Labels to the Tablix Data Region
We will now modify the existing labels and add new labels in the Tablix data region to make the tablix more informative.
Select the cell containing 'Product Category Id' and rename it to 'Category Id'.
Select the cell containing 'Product Product Name' and rename it to 'Product Name'.
Select the text box in the newly added subtotal column containing 'Total' and rename it to 'Total Price for the Year'.
Select the text box in the totals column containing 'Total' and rename it to 'Total Product Price'.
To add label to the categories total, select the last cell of the 'Product Name' column and enter the text 'Total'.
Your Tablix data region would now look like the following.
Improve the Layout of Tablix Data Region
Let's merge the blank cells with adjacent cells in the Tablix data region,
Select the cell containing text 'Category Id' and the blank cell below it. With the cells selected, right-click, go to Cells > Merge Cells.
Similarly, select the cell containing expression '=[Product.CategoryId]' and the cell below it and merge.
In the top row of the tablix, select the cell containing 'Total Product Price' and merge it with the blank cell below it.
Customize the Appearance of the Pivot Report
Note: You may need to resize and reposition the controls on the report to accommodate data, and for a cleaner look.
Set the text alignments for the text boxes in the tablix using TEXT - Text Align (Left, Right, Center, etc.) and TEXT - Vertical Text Align (Top, Middle, or Bottom) properties.
Set the font for the text boxes in the tablix data region to Song using the Text - Font Family property.
Change the page title from 'Orders by Year' to 'Orders by Category, Quarter, and Year'.
Set the display format to currency in the price fields - select the text boxes containing the price fields and set TEXT - Format to 'Currency'.
Use the Background - Color property to set the background color for the Tablix data region.
Preview and Save Report
Click Preview to view your report in the final output.
Exit the preview mode by clicking Back on the left side of the designer.
Click Save to open the Save dialog box. Enter the report name and click Save Report.