
- GettingStarted
- DeveloperGuide
-
ReportAuthorGuide
- Overview
- Quick Start
- Interface Elements
- Report Controls
- Data Binding
- Expressions
- Parameters
- Drill Down
- Drill Through
- Hyperlinks
- Sort
- Tutorial 1: Create Tabular Report
- Tutorial 2: Create Parameterized Report
- Tutorial 3: Create Master-Detail Report
- Tutorial 4: Create Pivot Report
- Tutorial 5: Create Report with Chart
- Report Templates
- Tutorial-6-Apply-Styles-and-Themes
- Compatibility-with-AR-NET
Drill Down Report
The drill down feature helps in temporarily hiding a part of your report. That hidden part can be controls, groups, columns, or rows. When you open a drill down report, part of the data is hidden so that you can only see high-level data until you request for more detail. In such reports, you find an expand icon (plus sign) on the toggle item. Clicking the toggle item or plus sign expands hidden content into view and the expand icon changes to a collapse icon (minus sign). When you click the collapse, the content is again hidden and the report is returned to its previous state.
To create a drill down report, use the Visibility properties of controls, groups, columns, or rows. Simply set the Visibility - Hidden property to 'True' and set the toggle item to the name of another item in the report, usually a text box in the group or a text box as a column label containing the hidden item. At run time, this puts a plus sign next to the toggle item which the user can click to display the hidden data.
This tutorial guides you through the steps to create a drill down report in ActiveReportsJS Designer.
Note: You need to create Simple Pivot Report before performing the following steps.
After you complete this tutorial, you will have a report that looks similar to the following.

Add Drill Down to the Pivot Report
Consider that you do not want the price details of each order year in the first view but want to drill down to year-wise prices later.
To do this, we will first add a label to the 'OrderYear' column group of the Tablix data region so we can toggle the price details from the added label.
Note that Advanced Properties Mode should be enabled to view Toggle Item property.
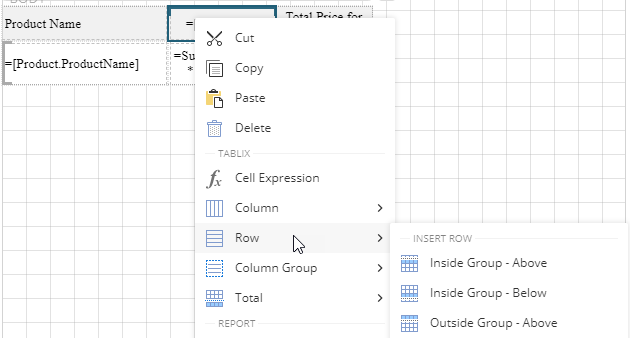
Right-click the 'OrderYear' column group area to view options in the context menu.
Go to the Row and select Outside Group - Above from the list.
To improve the layout, we will now merge the following existing cells in the tablix data region with their adjacent blank cells - 'Product Name' and 'Total Price for the Year' as shown. We will also add a label for the 'OrderYear' column group, that is, 'Order Year'.
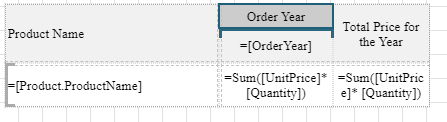
Note that we have changed the background and text properties for the labels.
From the Report Explorer
 , select the Tablix data region.
From the left pane of the designer, click the Group Editor icon
 to display the row groups and column groups in the tablix.
Select 'OrderYear' column group ('Tablix1_OrderYear1').
From the Properties pane, set the Visibility - Toggle Item property to the text box containing the label 'Order Year' (say, TextBox9).
Set the Visibility - Hidden to 'True'.

Preview and Save Report
Click Preview to view your report in the final output.
Click the (-) sign to expand the price details for each year. Click (+) sign to again see the aggregate price for all years.
Exit the preview mode by clicking Back on the left side of the designer.
Switch to the File tab and click Save to open the Save dialog box. Enter the report name and click Save Report. You can also provide a description and a revision comment for the report.