ActiveReports 18 .NET Edition
Report Authors: Designer Components / Data Binding / Data Binding in Page/RDLX Reports / Add Dataset
In This Topic
    Add Dataset
    In This Topic

    After connecting to a data source in a Page/RDLX report, you need to add a dataset. It is the dataset that contains the data to which a report connects. This article demonstrates the steps to add a dataset in a Page/RDLX report, and the various configuration settings available in the Dataset dialog box.

    A dataset fetches data from the data source to display in a report. The DataSet dialog is where you provide a command type and query string and choose other options for your dataset.

    You can also control the timeout period and other data options, and add fields, parameters, and filters to fetch the data you need. Once you have added a dataset, the dataset fields appear under the Data Source node in the Report Explorer. You can add multiple datasets for a data source. For example, you can use multiple data sets in a report when nesting data regions such as Tablix, List, Chart, BandedList, Table, and Sparkline.

    Furthermore, ActiveReports provides a Visual Query Designer for Microsoft SQL Client and Microsoft OLEDB providers and Query Designers for JSON and XML providers, which allow the users to build the dataset queries easily.

    Note: The dataset for a CSV data source is automatically added. The default name of the data set is the name of the CSV file selected. You can later modify the dataset through the Edit option in the context menu.

    Add a dataset

    1. In ActiveReports designer, go to the Report Explorer.
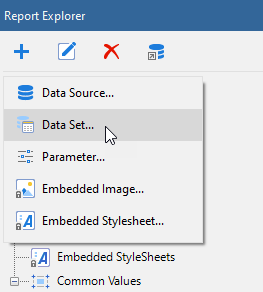
      • With the Data Source node (like DataSource1) selected, click the Add icon on the top left and select Data Set.

        Adding a Dataset to a Page/RDL report
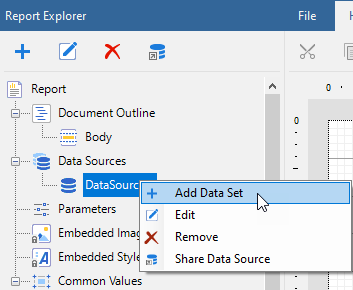
      • Right-click an existing data source and select Add Data Set.

        Adding a Dataset to a Page/RDL report
    2. In the DataSet dialog box that appears, select the General page and enter the name of the dataset. By default, the dataset name is set to DataSet1. This name appears as a child node to the Data Source node in the Report Explorer.
    3. Navigate to the Query tab. Based on the chosen command type, enter the query to retrieve the data from a database. You can verify the query by clicking the Validate DataSet icon Validate Icon in Report Data Source Dialog Box . See DataSet dialog properties for setting up the dataset.
      The availability of a specific query designer depends on the report's data source connection. For more information on query designers, see articles Query Builder in JSON and XML Providers and Query Builder in Microsoft SQL Client and OLEDB Providers.
         
    4. Click OK to save the changes.

    DataSet dialog properties

    The DataSet dialog provides the following pages where you can set the dataset properties. 

    The General page of the DataSet dialog is where you can set the name of the dataset.

    Name: Enter a name for the dataset. By default, the name is set to DataSet1. The name of the dataset appears in the tree view of the Report Explorer. It is also used to call the dataset in code so it should be unique within the report.

    The Query page of the DataSet dialog is where you set the SQL query, stored procedure, or table to define the data you want to fetch in the dataset of your report.

    Note: The Query page is unavailable for the CSV data provider.
    • Command type: You can choose from the three enumerated command types.

      • Select Text if you want to write an SQL query to retrieve data.
      • Select StoredProcedure if you want to use a stored procedure. This option is not available in SQLite, JSON, and XML data providers. See Stored Procedure as Dataset topic for more information.
      • Select TableDirect if you want to return all rows and columns from one or more tables. This option is available only in OLEDB data provider.
    • Query: Based on the command type you select above, you can set the query string in this field.

      Note:

      • If you select the TableDirect command type, you may need to use escape characters or qualifying characters in case any of the table names include special characters.
      • Specify the calculated index for arrays in a JSONPath expression in the following ways:

        • To obtain the last entry in an array, use -1: square brackets. For example, use $..book[-1:].
        • To obtain evaluated expressions correctly, the field names in square brackets should be in single quotes. For example, use $..book[0]['category','author'].

      To create multiple datasets based on the JSON data provider, check the Select multiple nodes option in the JSON Query Builder.

      For information on writing an SQL query that you can use for SQLite (Custom Data Provider), see the SQLite Tutorial. You will note that there are some differences in writing a standard SQL query and an SQL query for SQLite.

    • Timeout: Specifies the number of seconds you want the report server to wait for the query to return the data before it stops trying.

    The Options page is where you select the following options available for the dataset.

    Note: The Options page is unavailable in case of CSV, JSON, and XML data providers.
    • CaseSensitivity: Set this value to Auto, True, or False to indicate whether to make distinctions between upper and lower case letters. Auto, the default value, causes the report server to get the value from the data provider. If the data provider does not set the value, the report runs without case sensitivity.
    • Collation: Choose from Default or a country from the list to indicate which collation sequence to use to sort data. The Default value causes the report server to get the value from the data provider. If the data provider does not set the value, the report uses the server locale. This is important with international data, as the sort order for different languages can be different from the machine sort.
    • KanaTypeSensitivity: Set this value to Auto, True, or False with Japanese data to indicate whether distinctions are made between Hiragana and Katakana kana types. Auto, the default value, causes the report server to get the value from the data provider. If the data provider does not set the value, the report runs without kana type sensitivity.
    • WidthSensitivity: Set this value to Auto, True, or False with Japanese data to indicate whether distinctions are made between single-byte (half-width) characters and double-byte (full-width) characters. Auto, the default value, causes the report server to get the value from the data provider. If the data provider does not set the value, the report runs without width sensitivity.
    • AccentSensitivity: Set this value to Auto, True, or False to indicate whether distinctions are made between accented and unaccented letters. Auto, the default value, causes the report server to get the value from the data provider. If the data provider does not set the value, the report runs without accent sensitivity.

    The Fields page of the DataSet dialog populates automatically for OleDb, ODBC, SQL, JSON, CSV, and XML data providers. To see a list of fields in the Name and Value columns of the Fields page, enter a valid query, table name, or stored procedure on the Query page.

    You can edit the populated fields, delete them by using the Remove (X) icon, or add new ones by using the Add (+) icon above the Fields list. Any fields you add in this list show up in the Report Explorer tree view and you can drag and drop them onto the design surface. The field name must be unique within the dataset.

    When working with Fields, the meaning of the value varies depending on the data source type. In most cases, this is simply the name of the field. The following list describes the meaning of the field value and gives some examples of how to use the value.

    • In SQL and OleDb data sources, the field value is the name of a field returned by the query. For example,
      OrderQuantity
      FirstName
    • In Dataset data source, the field value can be the name of a field in the DataTable specified by the query. You can also use DataRelations in a DataSet, specify the name of the relation followed by a period and then the name of a field in the related DataTable. For example,
      Quantity
      OrdersToOrderDetails.CustomerID
    • In XML data source, the field value is an XPath expression that returns a value when evaluated with the query. For example,
      Statistics/Game/TeamName
    • In JSON data source, the field value is a JSONPath expression that returns a value when evaluated with the query. For example,
      $.Statistics.Game[*].TeamName
    • In Object data source, the field value can be the name of a property of the object contained in the collection returned by the data provider. You may also use properties available for the object returned from a property. For example,
      Quantity
      Order.Customer.FirstName
    • In CSV data source, the field value is the name of a field returned by each column specified in the connection string. For example,
      Path=C:\\FixedWidth.csv;Locale=en-US;TextQualifier=";ColumnsSeparator=,;RowsSeparator=\r\n;HasHeaders=True
      

    The Parameters page of the Dataset dialog is where you can pass a Report Parameter into the parameter you enter in the Query page. You can edit the populated fields, delete them by using the Remove (X) icon, or add new ones by using the Add (+) icon above the Parameters list. For each parameter in this list, there is a Name and a Value.

    Note: This Parameters page is unavailable for the CSV, JSON, and XML data providers.
    Enter a Name that matches the name of the Report Parameter and a Value for each parameter in this page. The Name of the parameter must be unique within the dataset.

    The Value of parameter can be a static value or an expression referring to an object within the report. It cannot refer to a report control or field. For more information, see Adding Parameter for different data sources.

    The Filters page of the Dataset dialog allows you to filter data after it is returned from the data source. This is useful when you have a data source (such as XML) that does not support query parameters.

    You need to provide three values to add a new filter to the collection: Expression, Operator, and Value.

    Expression: Enter the expression to use for evaluating whether data should be included in the group.

    Operator: Select from the following operators to decide how to compare the expression to the left with the value to the right.

    • Equal Only choose data for which the value on the left is equal to the value on the right.
    • Like Only choose data for which the value on the left is similar to the value on the right.
      For more information on using the Like operator, see the MSDN Web site.
    • NotEqual Only choose data for which the value on the left is not equal to the value on the right.
    • GreaterThan Only choose data for which the value on the left is greater than the value on the right.
    • GreaterThanOrEqual Only choose data for which the value on the left is greater than or equal to the value on the right.
    • LessThan Only choose data for which the value on the left is less than the value on the right.
    • LessThanOrEqual Only choose data for which the value on the left is less than or equal to the value on the right.
    • TopN Only choose items from the value on the left which are the top number specified in the value on the right.
    • BottomN Only choose items from the value on the left which are the bottom number specified in the value on the right.
    • TopPercent Only choose items from the value on the left which are the top percent specified in the value on the right.
    • BottomPercent Only choose items from the value on the left which are the bottom percent specified in the value on the right.
    • In Only choose items from the value on the left which are in the array of values specified on the right.
      Selecting this operator enables the Values list at the bottom.
    • Between Only choose items from the value on the left which fall between the pair of values you specify on the right. Selecting this operator enables two Value boxes instead of one.

    Value: Enter a value to compare with the expression on the left based on the selected operator. For multiple values used with the Between operator, the lower two value boxes are enabled.

    Values: When you choose the In operator, you can enter as many values as you need in this list.

    See Also