The Area Chart displays quantitative data and is based on the Line chart. In Area charts, the space between axis and line are commonly emphasized with colors, textures and hatchings.
This section describes 2D charts that fall under the Area Chart category (ChartType Area2D).
Area Chart
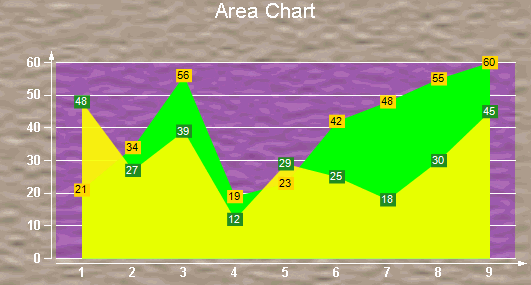
An area chart is used to compare trends over a period of time or across categories.
Stacked Area Chart
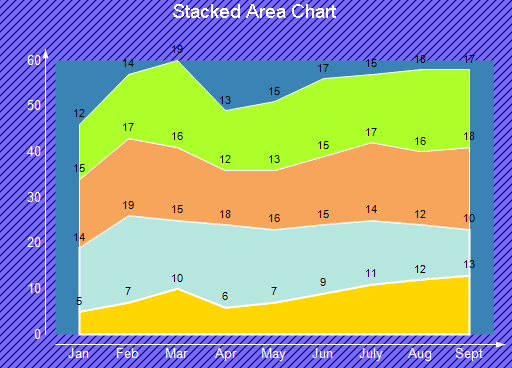
A stacked area chart is an area chart with two or more data series stacked one on top of the other. Use this chart to show how each value contributes to a total.
Stacked Area 100% Chart
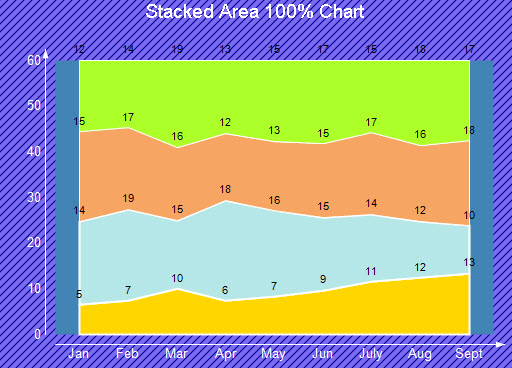
A stacked area chart (100%) is an 100% area chart with two or more data series stacked one on top of the other. Use this chart to show how each value contributes to a total.
This section describes 3D charts that fall under the Area Chart category (ChartType Area3D).
Simple Area Chart
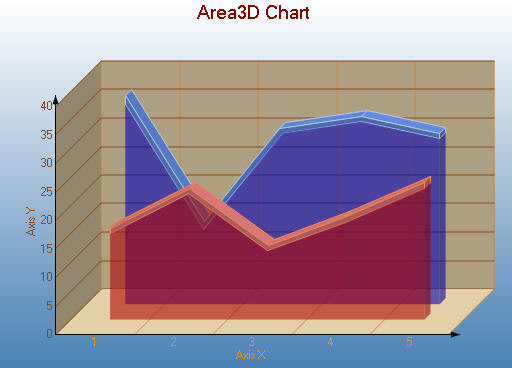
Use a 3D area chart to compare trends in two or more data series over a period of time or in specific categories, so that data can be viewed side by side.
Stacked Area Chart
A stacked area chart is an area chart with two or more data series stacked one on top of the other. Use this chart to show how each value contributes to a total.
Stacked Area 100% Chart
A stacked area chart (100%) is an 100% area chart with two or more data series stacked one on top of the other. Use this chart to show how each value contributes to a total.