The Chart Wizard guides you through the process of creating a chart. When you drag and drop the Chart control onto the report design surface, the Chart Wizard is displayed.
The first screen of the Chart Wizard asks you to select a data set and a chart type.

After a chart type is selected, specify the plot properties in the next screen of the wizard.
In the second screen of the Chart Wizard, specify the plot properties to configure the data values, category encodings, and detail encodings.
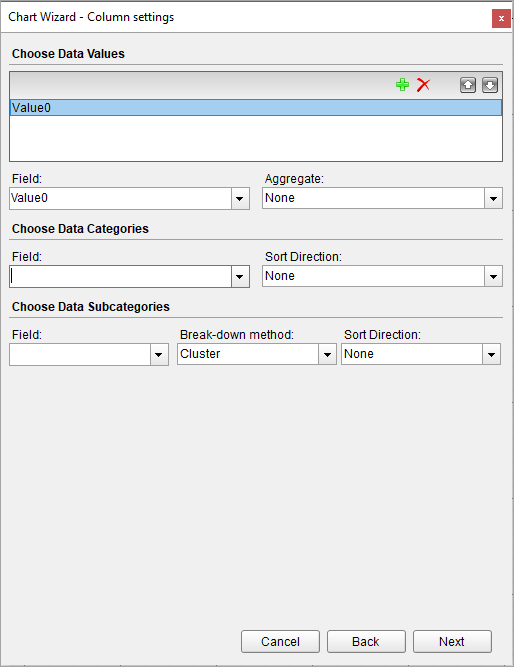
Add - adds a data field to the Y-axis.
Remove - removes a data field.
Up - moves a selected data field up.
Down - moves a selected data field down.
Field
The values in the Data Value Field specify the fields to be plotted on Y-Axis. If there is only one value, then the Y-Axis Title is set to the corresponding field name. If there are multiple values, but no Details encoding is set, then the chart automatically displays the global legend filled with value field names.
Aggregate
Data field aggregate function. An Aggregate function evaluates all the data value fields into a single value. Choose the aggregate function from Average, Count, CountOfAll, List, Min, Max, PopulationStandardDeviation, PopulationVariance, Range, StandardDeviation, Sum, Variance.
Field
The category mapping in the Data Categories Field groups the data into multiple categories for each unique value (or numerical range) that exists for the specified field. The title of X-Axis is set to the corresponding category field name.
Sort Direction
Choose the data sorting direction from None, Ascending, or Descending. The sort direction is automatically set to the Category Field.
Field
Adds a subcategory group to the data.
Break-down method
Select the way you want the additional groups to arrange from Cluster, Stacked, or Percentage.
Sort Direction
Choose the data sorting direction from None, Ascending, or Descending. The sorting field is automatically set to the subcategory field.
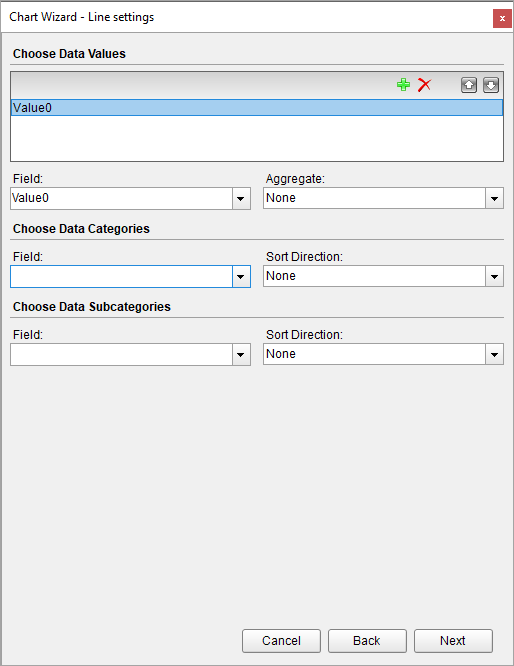
Field
The values in the Data Value Field specify which fields should be plotted. If there is only one value, then the title of Y-Axis is set to the corresponding field name. If there are multiple values, but no Details encoding is set, then the chart automatically displays the global legend filled with value field names.
Aggregate
Data field aggregate function. An Aggregate function evaluates all the data value fields into a single value. Choose the aggregate function from Average, Count, CountOfAll, List, Min, Max, PopulationStandardDeviation, PopulationVariance, Range, StandardDeviation, Sum, Variance.
Field
The category mapping in the Data Categories Field groups the data into multiple categories for each unique value (or numerical range) that exists for the specified field. The title of X-Axis is set to the corresponding category field name.
Sort Direction
Choose the data sorting direction from None, Ascending, or Descending. The sort direction is automatically set to the category field.
Field
Adds a subcategory group to the data.
Sort Direction
Choose the data sorting direction from None, Ascending, or Descending. The sorting field is automatically set to the subcategory field.
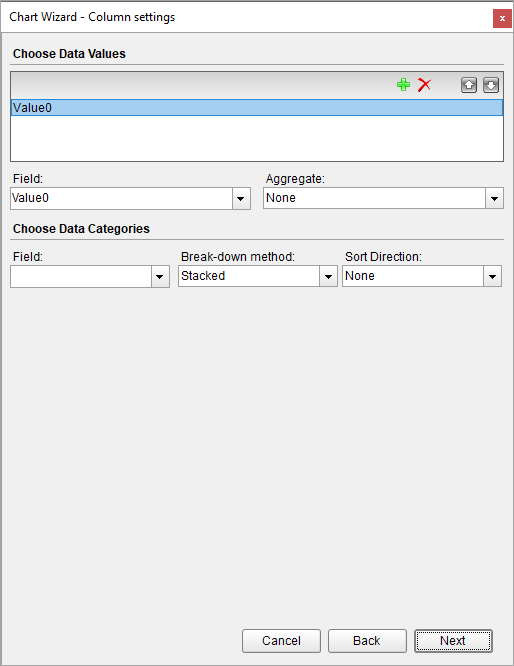
Field
The category mapping in the Data Categories Field groups the data into multiple categories for each unique value (or numerical range) that exists for the specified field. The title of X-Axis is set to the corresponding category field name.
Sort Direction
Choose the data sorting direction from None, Ascending, or Descending. The sort direction is automatically set to the Category Field.
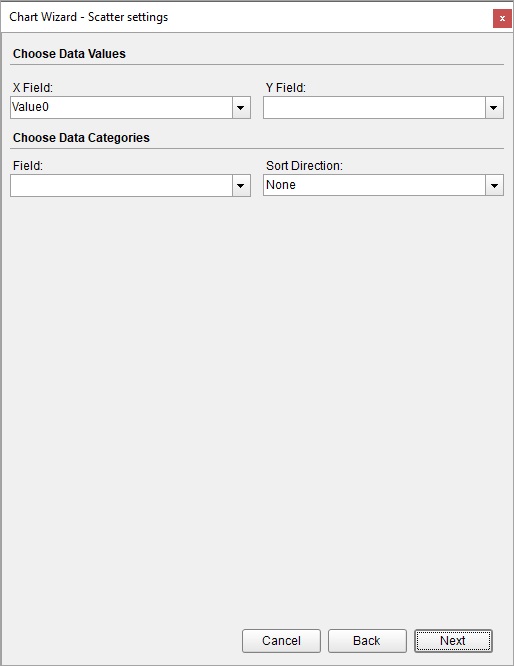
For scatter plot charts, the values property includes mappings for both X and Y.
X Field
Enter an expression to use as an X value. The title of X-Axis is set to the X Field value.
Y Field
Enter an expression to use as a Y value. The title of Y-Axis is set to the Y Field value.
Field
The category mapping in the Data Categories Field groups the data into multiple categories for each unique value (or numerical range) that exists for the specified field.
Sort Direction
Choose the data sorting direction from None, Ascending, or Descending. The sorting field is automatically set to the subcategory field.
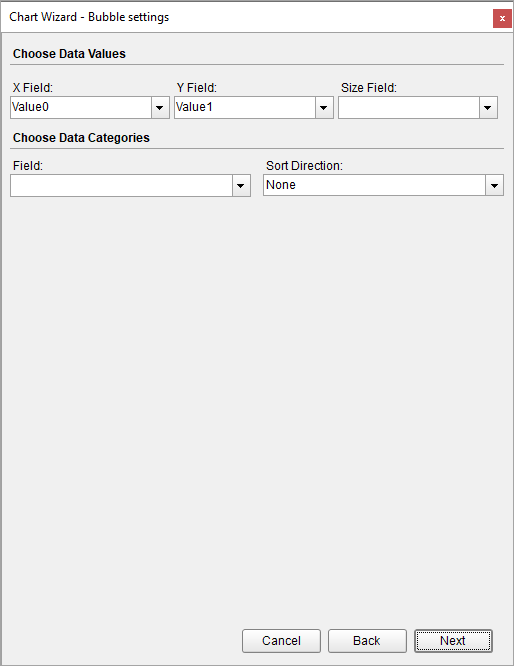
For scatter plot charts, the values property includes mappings for both X and Y.
X Field
Enter an expression to use as an X value. The title of X-Axis is set to the X Field value.
Y Field
Enter an expression to use as a Y value. The title of Y-Axis is set to the Y Field value.
Size Field
Enter an expression to use as the bubble size value.
Field
The category mapping in the Data Categories Field groups the data into multiple categories for each unique value (or numerical range) that exists for the specified field.
Sort Direction
Choose the data sorting direction from None, Ascending, or Descending. The sorting field is automatically set to the subcategory field.
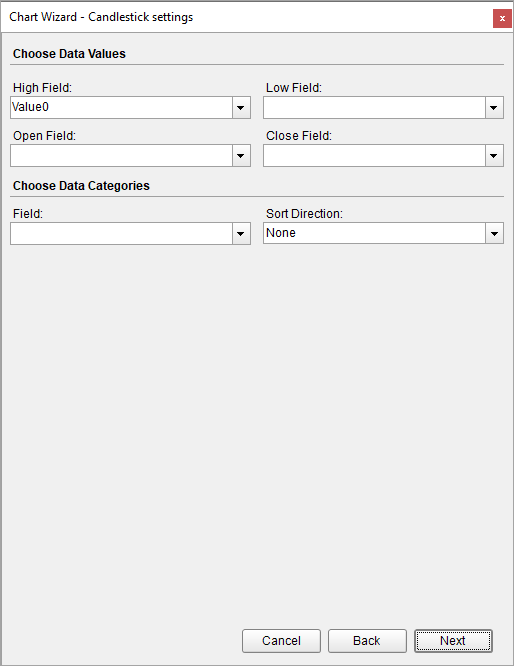
High Field
Enter an expression to use as the high value.
Low Field
Enter an expression to use as the low value.
Open Field (for Open High Low Close and Candlestick chart type)
Enter an expression to use as the open value.
Close Field
Enter an expression to use as the close value.
Field
The category mapping in the Data Categories Field groups the data into multiple categories for each unique value (or numerical range) that exists for the specified field. The title of X-Axis is set to the corresponding category field name.
Sort Direction
Choose the data sorting direction from None, Ascending, or Descending. The sort direction is automatically set to the category field.
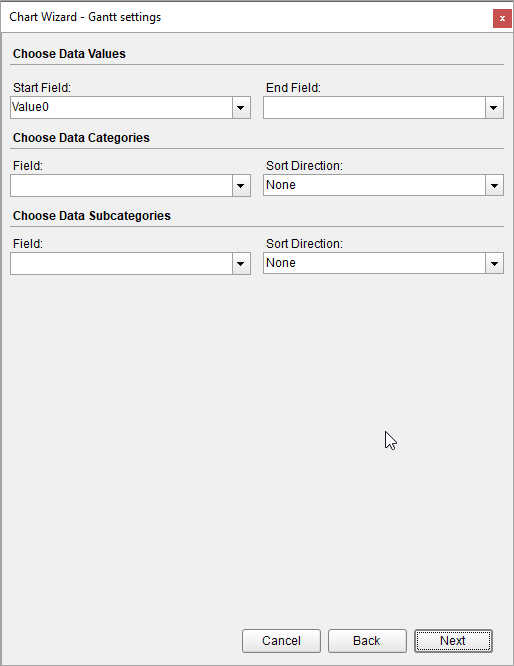
Start Field
An expression to use as the start value or the lower value.
End Field
An expression to use as the end value or the upper value.
Field
The category mapping in the Data Categories Field groups the data into multiple categories for each unique value (or numerical range) that exists for the specified field.
Sort Direction
Choose the data sorting direction from None, Ascending, or Descending. The sort direction is automatically set to the category field.
Field
Adds a subcategory group to the data.
Sort Direction
Choose the data sorting direction from None, Ascending, or Descending. The sorting field is automatically set to the subcategory field.
Select a chart palette from the drop-down list. Click Finish to add the chart to the report or choose any of the advanced customization options by clicking it.
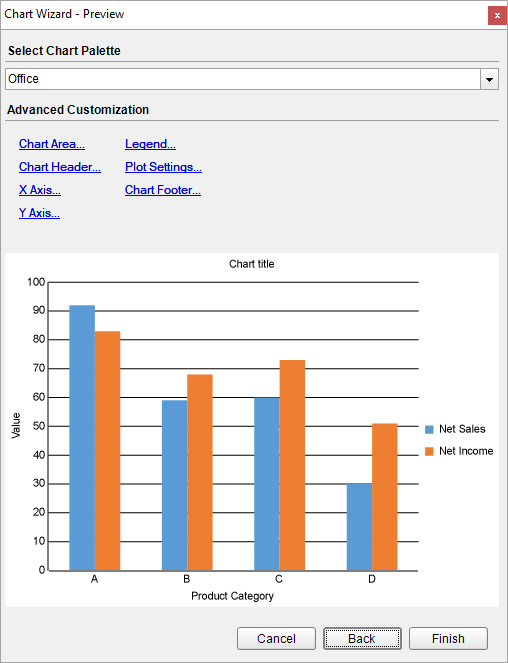
Select a color palette for the chart from a list of predefined palettes.
Clicking any of the advanced customization options opens a corresponding chart smart panel.
To learn about the chart smart panels, see Chart Smart Panels.