The Charting sample provides an option to choose from various chart types and a button to display the selected chart in a Viewer control.
Visual Basic.NET
https://github.com/activereports/Samples18/tree/main/API/Section/Charting/VB.NET
C#
https://github.com/activereports/Samples18/tree/main/API/Section/Charting/C#
Chart type combobox
Select from the following ChartType options.
Report Display button
Click this button to display the selected chart type in a Viewer control.
Note: To run rpt2DBar, rpt3DPie and rpt3DBar report, you must have access to the Nwind database. The NWIND.db file can be downloaded from GitHub: ..\Samples18\Data\NWIND.db.
ViewerForm
The ViewerForm contains the Viewer control, with the Dock property set to Fill. This enables the viewer to automatically resize along with the form. Right-click the form and select View Code to see the code used to run the report and display it in the viewer.
rpt2DBar report
Displays bar chart on a report. Retrieves the data to be displayed in a chart from Orders table in Nwind.db database. Settings for chart data source can be done using the Chart Data Source dialog.
rpt3DBar report
Displays 3D bar chart on a report. Retrieves the data to be displayed in a chart from Orders table in Nwind.db database. Generates a DataSet for the chart in ReportStart event and sets it in DataSource property of Chart control.
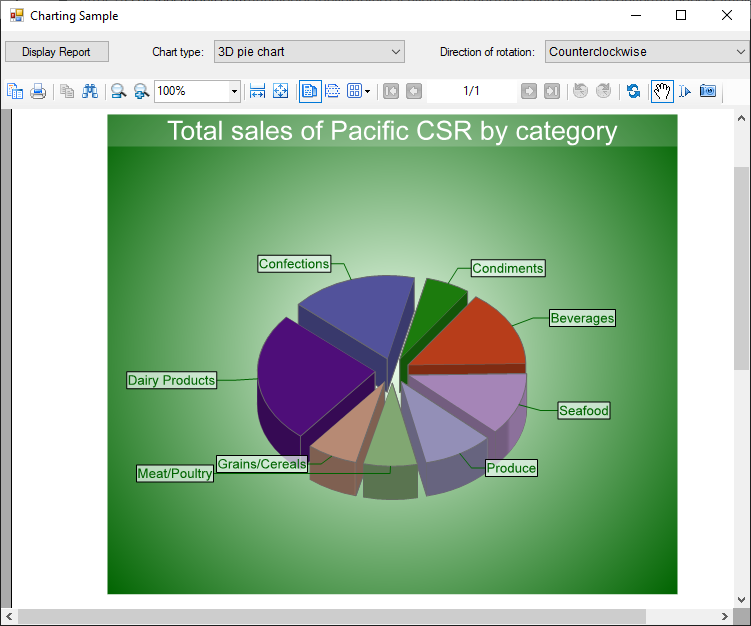
rpt3DPie report
Displays 3D pie chart on a report. Retrieves the data to be displayed in a chart from each of the Employees, Categories, Products, Orders, Order Details tables in Nwind.db database. Generates a DataTable for the chart in a ReportStart event and sets it in DataSource property of Chart control. Rotational direction of 3D pie chart can be set to Clockwise or Counterclockwise.
rptCandle report
Displays candle chart on a report. Chart data is set at design time using DataPoint Collection Editor. DataSource property is not used for this chart.
rptStackedArea report
Displays stacked area chart on a report. Chart data is set at design time using DataPoint Collection Editor. DataSource property is not used for this chart.