ActiveReports 18 .NET Edition
Report Authors: Designer Components / Design Reports / Design Page/RDLX Reports / Tutorials: Page/RDLX Report Scenarios / Create Multi-Column Layout (or Columnar report)
In This Topic
    Create Multi-Column Layout (or Columnar report)
    In This Topic

    This topic describes creating a columnar report layout in RDLX and Page reports.

    RDLX Report

    There are two ways to create a Columnar layout in an RDLX report.

    Using RowsOrColumnsCount and Count properties of the List data region

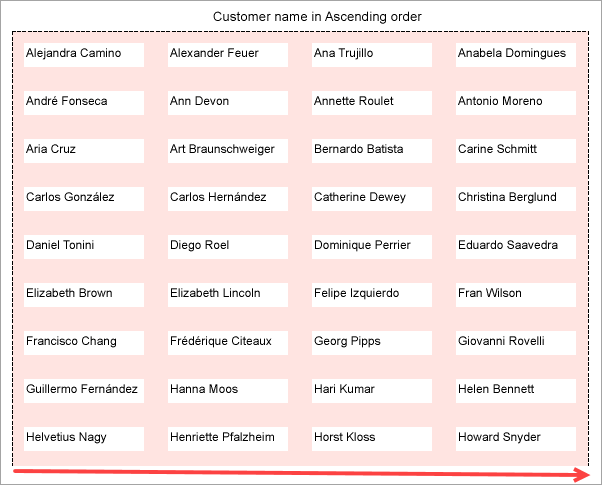
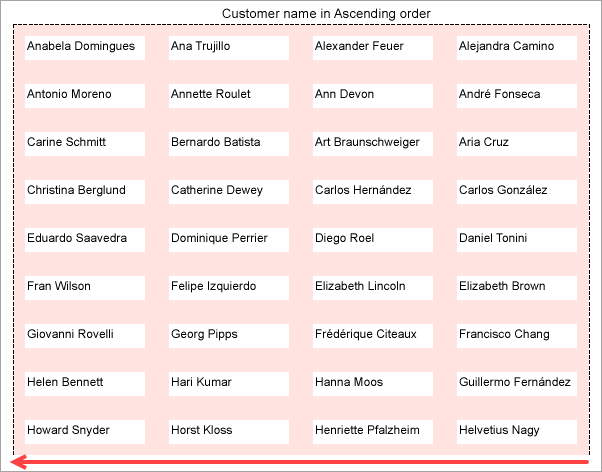
    List data region available in Page and RDLX reports (RDLX and RDLX Dashboard), supports generating multiple columns or rows with the help of the following properties:

    If the GrowDirection = Column and the Count = number of columns say 4, then the data is rendered horizontally in 4 columns. The rest of the list is populated based on the data region's fixed size. Also, if the GrowDirection = Row and the Count = number of rows say 8, then the data is rendered vertically in 8 rows. The rest of the list is populated based on the data region's fixed size.

    Go through the tutorial on Create Gauge Chart, which provides step-wise instructions on how a multi-column list layout is used for gauge charts to display the units in stock in each category of products.

    Using the Columns property of the Report's Body

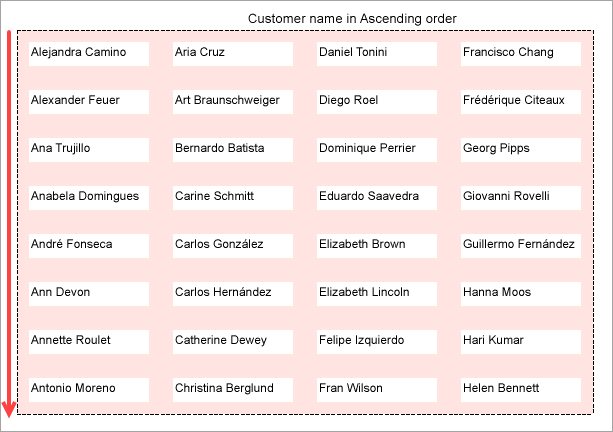
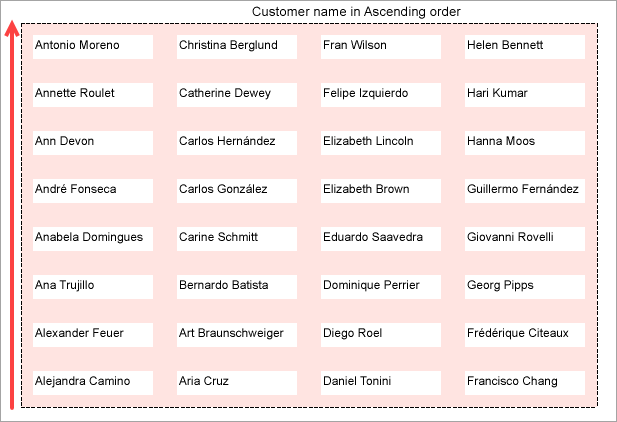
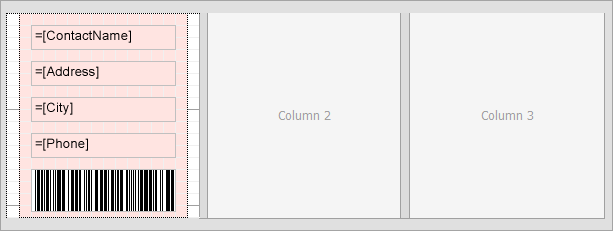
    This section talks about creating a columnar report layout in an RDLX report by using the Columns property of the report's Body.

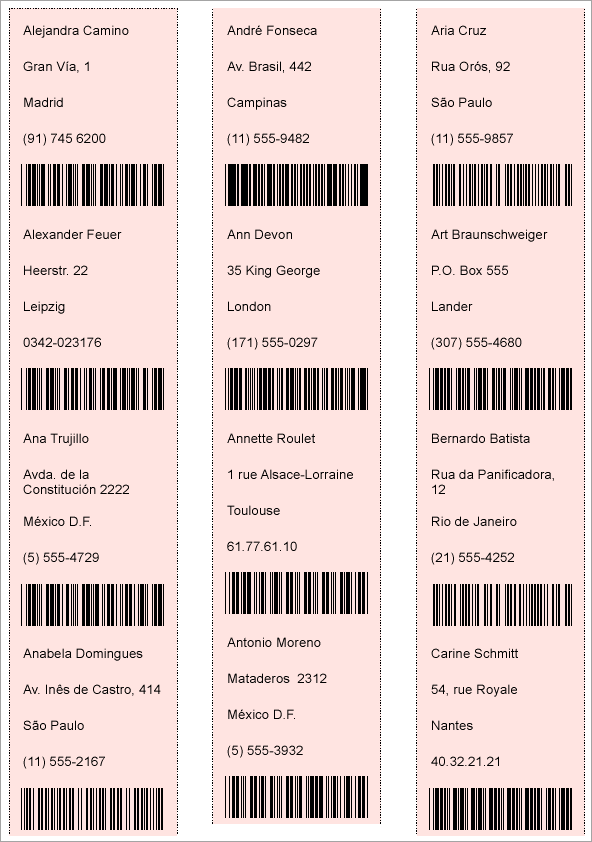
    The final report will look as shown.

    RDL Report with Columns Set for Report Body

    Create a Report

    In the ActiveReports Designer, create a new RDLX Report. 
    Bind Report to Data
    1. As you create a new report, the Report Data Source dialog appears for you to configure the report data connection. You can also access this dialog by right-clicking the Data Sources node in the Report Explorer and then selecting the Add Data Source option.
    2. In the dialog, select the General page and enter a name for the data source.
    3. Select 'SQLite Provider'. See Custom Data Provider for more information.
    4. Enter the Connection String similar to the following based on the location of nwind.db file:
      Connection String
      Copy Code
      data source= C:\data\nwind.db;
      
    5. Click OK.
    6. In the DataSet dialog that appears, set the Name as 'DataSet1'.
    7. Go to the Query page and enter a query in the Query textbox in the following format:
      DataSet Query
      Copy Code
      Select * from Customers order by ContactName
      
    8. Click the Validate DataSet icon Validate DataSet Icon to validate the query. If there is no warning, it means the query is validated. Then click OK to close the dialog.

    Design Report Layout

    Create a Column Layout for the Report
    1. In the Report Explorer, select Body.
      Report Body
    2.  Set the following properties in the Properties panel:
      Property Name Property Value
      Columns 3
      ColumnSpacing 0.10in
      Size

      2in, 2.15in 

      Populate Data in Report
    3. Drag and drop the List data region onto the design surface.
    4. Go to Report Explorer, expand the DataSet1 node, and drag and drop the following fields inside the List data region, one below the other, with their Value property set to the following fields:
      • =Fields!ContactName.Value
      • =Fields!Address.Value
      • =Fields!City.Value
      • =Fields!Phone.Value        
    5. From the toolbox, drag and drop the Barcode control below =Fields!Phone.Value field, inside the List data region, and set its Value property to =Fields!PostalCode.Value.    
    6. Ensure that the DataSetName property of the List data region is set to 'DataSet1'.
    7. You will also need to adjust the Size (for example, 1.75in, 2.125in in our case) of the List data region to accommodate the data in the specified columns.
    8. Set the BackgroundColor property of the list to say, 'MistyRose'.
      RDL Report with Columns Set for Report Body
    9. Improve the appearance of the report.

    Preview Report

    The final report is shown here.

    Page Report

    There are two ways to create a Columnar layout in Page report.

    Using RowsOrColumnsCount and Count properties of the List data region

    List data region can be used in Page report in a similar way as RDLX report, to create columnar reports, such as an address labels report. See this Create Address Labels in Page Report topic for details on creating a columnar report.

    Using OverflowPlaceholder control

    See Create Columnar Reports with OverflowPlaceholder Control topic for details.