A Red Negatives report is a report type that shows negative values in red color such that these values meet the requirements set in a conditional expression. A Green Bar report can be similarly created by alternating the background color of a data region like a Table using conditional formatting.
The following steps show how to generate a report with negative values in red negatives.
| DataSet Query |
Copy Code
|
|---|---|
SELECT AccountsChart.AccountId, AccountsChart.ParentId, AccountsChart.Description, AccountsChart.Rollup, Expenses.ExpenseDate, Sum(Expenses.Amount) AS SumOfAmount FROM AccountsChart LEFT JOIN Expenses ON AccountsChart.AccountId=Expenses.AccountID GROUP BY AccountsChart.AccountId, AccountsChart.ParentId, AccountsChart.Description, AccountsChart.Rollup, Expenses.ExpenseDate ORDER BY Expenses.ExpenseDate, AccountsChart.AccountId; |
|
=iif(Fields!Rollup.Value < 0, "Red", "Black")
=iif(Fields!FieldName.Value < 0, "Red", "Black") where FieldName refers to field that the textbox contains (of integer type).
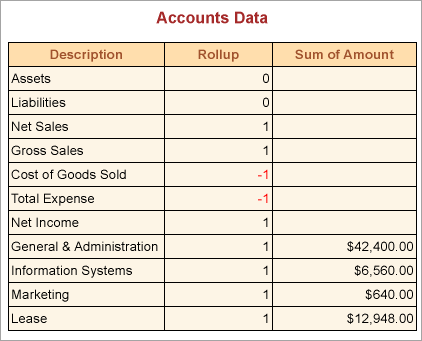
The following image illustrates a report that contains negative values in red:
For a green bar report, click the row handle to the left of the detail row of a Table data region and set the following expression in the BackgroundColor property:
=iif(RowNumber(Nothing) Mod 2, "PaleGreen", "White")
On previewing the report, you will notice that every alternate detail the report displays has a green background as depicted by the following image.

Note that with Detail Grouping applied on a table, the background color will not appear as expected.