Financial charts are those which are specific to representing data related to financial activities. The Chart data region can draw a number of financial chart types:
Candle
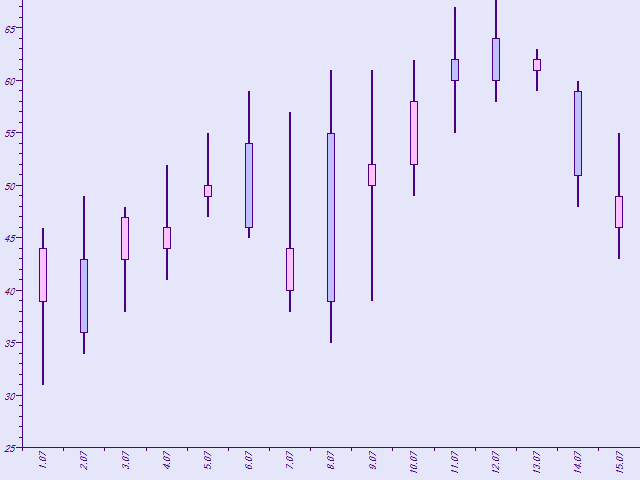
A candle chart displays stock information, using High, Low, Open and Close values. The size of the wick line is determined by the High and Low values, while the size of the bar is determined by the Open and Close values. The bar is displayed using different colors, depending on whether the price of the stock has gone up or down.
HiLo Chart
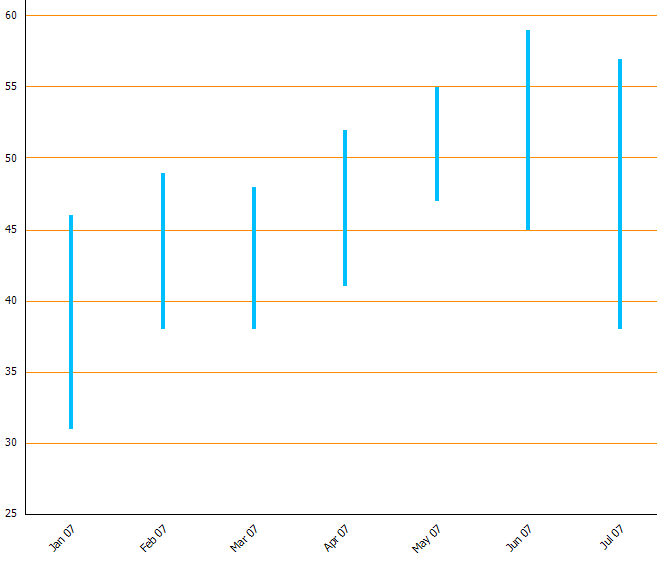
A HiLo chart displays stock information using High and Low, or Open and Close, values. The length of the HiLo line is determined by the High and Low values, or the Open and Close values.
Point and Figure Chart
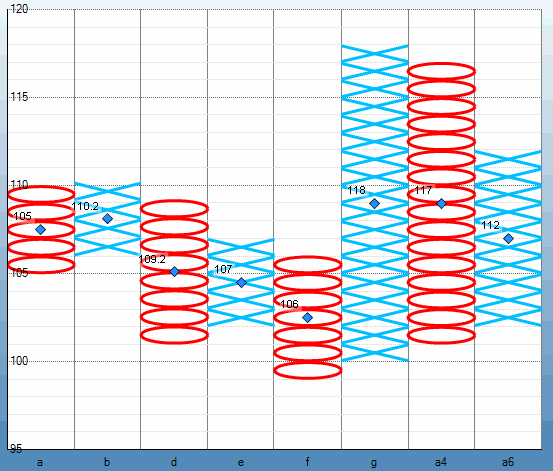
The point and figure chart uses stacked columns of X's to indicate that demand exceeds supply and columns of O's to indicate that supply exceeds demand to define pricing trends. A new X or O is added to the chart if the price moves higher or lower than the BoxSize value. A new column is added when the price reverses to the level of the BoxSize value multiplied by the ReversalAmount. The use of these values in the point and figure chart to calculate pricing trends makes this chart best suited for long-term financial analysis.
Renko Chart
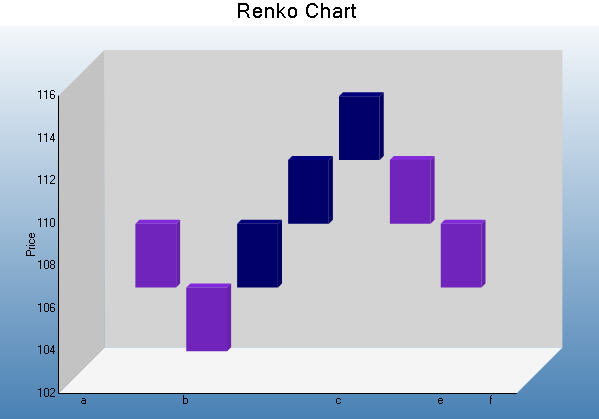
The Renko chart uses bricks of uniform size to chart price movement. When a price moves to a greater or lesser value than the preset BoxSize value required to draw a new brick, a new brick is drawn in the succeeding column. The change in box color and direction signifies a trend reversal.
Kagi Chart
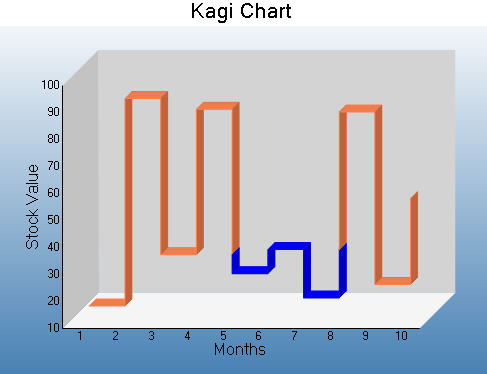
A Kagi chart displays supply and demand trends using a sequence of linked vertical lines. The thickness and direction of the lines vary depending on the price movement. If closing prices go in the direction of the previous Kagi line, then that Kagi line is extended. However, if the closing price reverses by the preset reversal amount, a new Kagi line is charted in the next column in the opposite direction. Thin lines indicate that the price breaks the previous low (supply) while thick lines indicate that the price breaks the previous high (demand).
Stock Chart
In a stock chart, series are displayed as a set of lines with markers for high, low, close, and open values. Values are represented by the height of the marker as measured by the y-axis. Category labels are displayed on the x-axis.
Stock chart is a visual representation of data related to the stock market. It may be used to represent data like stock prices and stock activities.
Stock Close Only Chart
A Stock chart is a visual representation of data related to the stock market. This type of chart requires four series of values in the correct order (open, high, low, and then close).
Stock Open Only Chart
A Stock chart is a visual representation of data related to the stock market. This type of chart requires four series of values in the correct order (open, high, low, and then close), low, and then close).
Three Line Break Chart
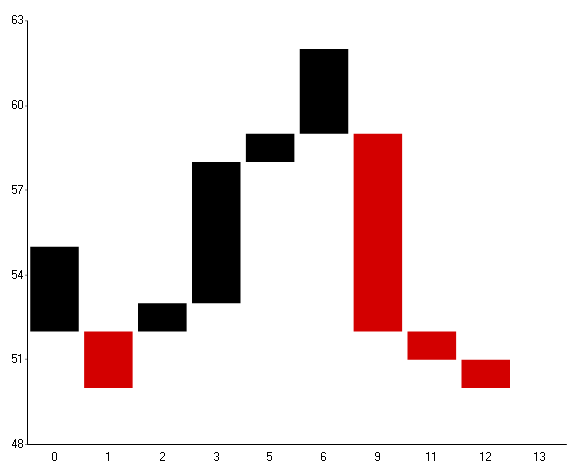
A Three Line Break chart uses vertical boxes or lines to illustrate price changes of an asset or market. Movements are depicted with box colors and styles; movements that continue the trend of the previous box paint similarly while movements that trend oppositely are indicated with a different color and/or style. The opposite trend is only drawn if its value exceeds the extreme value of the previous three boxes or lines. The below Three Line Break depicts upward pricing movement with black boxes and downward pricing movement with red boxes.
Kagi Chart
A Kagi chart displays supply and demand trends using a sequence of linked vertical lines. The thickness and direction of the lines vary depending on the price movement. If closing prices go in the direction of the previous Kagi line, then that Kagi line is extended. However, if the closing price reverses by the preset reversal amount, a new Kagi line is charted in the next column in the opposite direction. Thin lines indicate that the price breaks the previous low (supply) while thick lines indicate that the price breaks the previous high (demand).
Renko Chart
The Renko chart uses bricks of uniform size to chart price movement. When a price moves to a greater or lesser value than the preset BoxSize value required to draw a new brick, a new brick is drawn in the succeeding column. The change in box color and direction signifies a trend reversal.
Three Line Break Chart
Three line break 3D chart is a chart rendered in 3D.