A Gantt chart is a common chart type used in project management. Gantt plots provide the most useful ways of displaying activities (tasks or events) against time periods. Gantt charts can also be used to schedule big projects by breaking them into tasks and subtasks. The Gantt plot helps lay the tasks and subtasks on a timeline. In the Gantt chart, each task is listed on the chart's one side and each has a horizontal bar opposite it corresponding to the task length. By using the Gantt chart, you can find out how long each task will take and which tasks can overlap.
See Create Gantt Chart walkthrough to learn how the immunization schedule can be laid out using the Gantt chart.
A Gantt chart is made of essential elements, such as:
The plot properties discussed below can be accessed from the Properties Panel on selecting the Chart > Plot from the Report Explorer. You can access some of the important properties from the Plot's Smart Panel too. See Chart Smart Panels topic for more information. Both the Properties Panel and the Smart Panel can be accessed by right-clicking the plot in the design area.
Indicates the color used to fill the chart area.
The action to perform when the plot is clicked. The action can be a hyperlink, a bookmark, or a drill-through.
The data labels for each chart.
The line style for the border of the bars. Includes the following properties for the customization.
The name of the plot. By default, a chart containing a single plot has the plot name as 'Plot1'.
Contains the tooltip template settings. You can choose from the list of predefined settings or set your own in the Expression Editor.
The BarLineStyle settings are applied when the ShowBarLines property is set to True.
The Clipping Mode determines how a plot extends within the plot area. The ClippingMode can be set to:
Indicates the plot offset in percentage.
The Opacity is the percentage value of the opacity of the plot fill color. 100% opacity means that the plot fill color is opaque while 0% opacity means that the plot fill color is completely transparent.
Overlays property is a collection for superimposing the data trend on a plot. For more information, see Trendlines topic.
Rules control the appearance of plots based on specified conditions. For more information on conditions, see Rules topic.
Represents how null or empty values should be shown in the plot - Gaps (default), Connected, or Zeros.
Setting this to True shows the bar lines in the chart.
The BarSettings specifies the bar-style settings.
The Category Encoding of a plot is a set of properties that determine the period over which the plot generates connected data points representing those above Data Values. The Category encoding includes the following properties.
Values
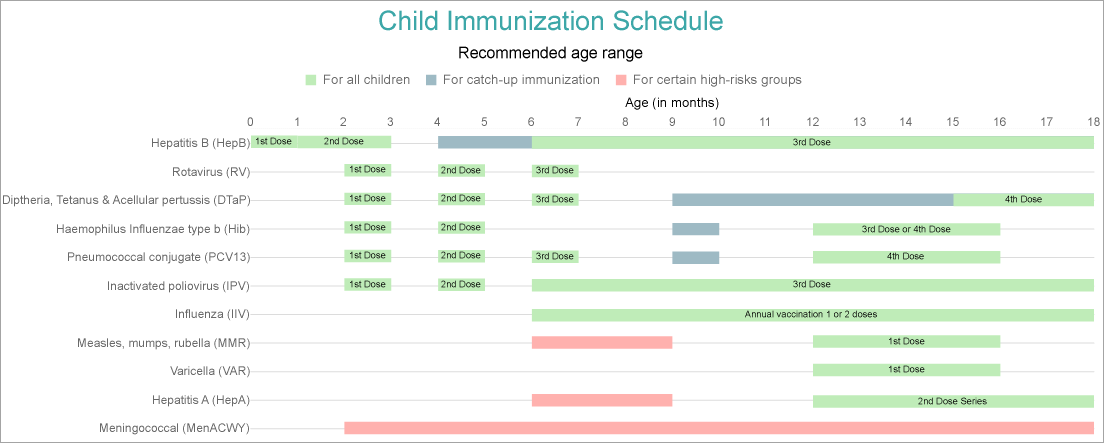
The Values property is the collection and takes the field as a category. See the Create Gantt Chart walkthrough where Values is set to [Vaccine].
SortingField
The SortingField defines the order in which the categories are displayed. It takes the default same as the Values field, but you can also specify another field to sort the categories.
SortDirection
The SortDirection defines the ascending or descending order in which the categories should be sorted.
SortingAggregate
The SortingAggregate property specifies the aggregate to use for sorting the categories.
The Color Encoding enables the color legend of the Details or Category Encoding. It includes the following properties:
Action
The action to take when the color legend is clicked.
Aggregate
Aggregates the value of Color expression.
ShowValuesName
If set to True, the legend is displayed based on the value specified in Details encoding or Color encoding.
Values
The Values is the collection where the value of the Color expression is specified. However, the charts take the first item from the collection. See the Create Gantt Chart walkthrough where Values is set to [Range].
The Details Encoding breaks down the data values into subcategories and produces additional groups. The Details property is the collection of items and each item includes the following properties that define the Details encoding:
The Values encoding specifies the data values and represents the collection of items and each item includes the following properties.
Type
The Type property provides 'Simple' and 'Complex' options to choose from. However, for Gantt charts, 'Complex' is acceptable.
Subfields
The Subfields property is the collection and takes a start field that goes to the lower value and an end field that goes to the upper value.
Aggregate
To show aggregated values such as Average, Count, and Sum instead of individual values, specify an Aggregate function.
See the Create Gantt Chart walkthrough where Type is set to 'Complex' and Subfields are set to [Start] and [End] fields.
The Text Encoding provides support of any dataset field in chart labels and tooltips and allows displaying additional info on the chart. When two text encodings are added, they are displayed by default with the ";" delimiter. A text encoding includes the following properties:
Aggregate
Aggregates the value of the Text expression.
Target
Specifies whether this text is for a Label or a Tooltip Label. The label format is controlled with the chart's Labels > Template property or Tooltip Template property.
The Template property can use both the predefined values and the added text encoding fields, for example:
Count:{Text0}
Sum:{valueField.value}
Template Key
A unique key, used in the chart plot's Labels > Template and Tooltip Template to access the text encoding value.
Value
A field, constant or expression to be displayed.