The Line Chart is a type of chart that displays information as a series of data points, connected by straight line segments.
Bezier Chart
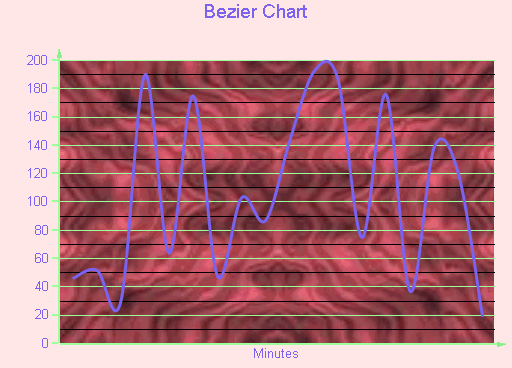
Use a Bezier or spline chart to compare trends over a period of time or across categories. It is a line chart that plots curves through the data points in a series.
Bezier XY Chart
A Bezier XY chart connects DataPoints on X and Y with curved lines.
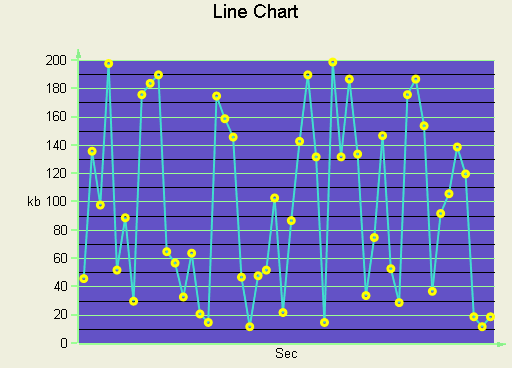
Simple 2D Line Chart
Use a 2D line chart to compare trends over a period of time or in certain categories in a 2D format.
Line XY Chart
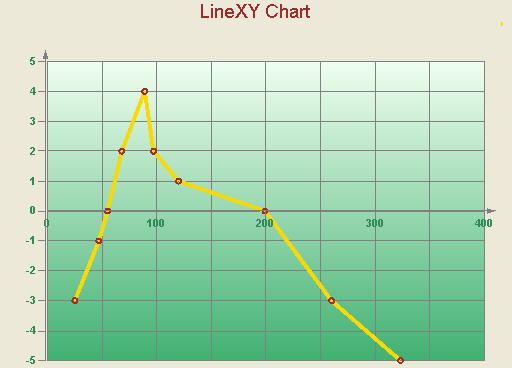
A line XY chart plots points on the X and Y axes as one series and uses a line to connect points to each other.
Bezier Chart
Render a Bezier or Spline chart in 3D format.
Line Chart
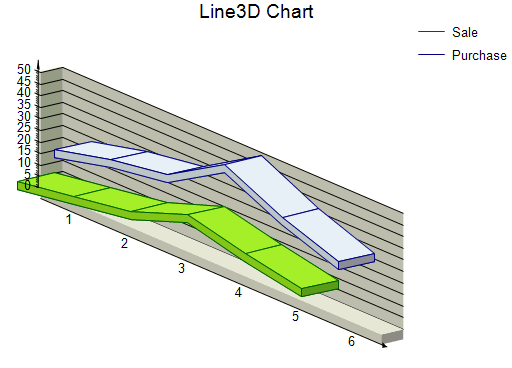
Use a 3D line chart to compare trends over a period of time or in certain categories in a 3D format.