Note:
The Matrix data region contains columns and rows in which the data is inserted and arranged. Columns and rows in a matrix can be dynamic or static. Each cell in a matrix contains a textbox by default, but as with the other data regions, the textbox can be replaced with any other report control. Also like other data regions, the matrix also repeats each report control it contains for each row in the dataset, but unlike the others, it also repeats horizontally for dynamic columns.
Cells
When you drop a matrix data region onto your report, it is initially composed of four cells.
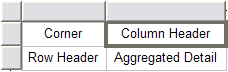
The top left cell is the corner or label cell. You can leave this cell blank or use it to display a label for the matrix.
The top right cell is a column header and the bottom left cell is a row header. You can drag fields into these cells or use expressions to group the data.
The bottom right cell is used to aggregate the detail data. At run time, detail cells display aggregates of the intersections of columns and rows.
Data
The matrix data region is associated with a dataset. You can make this association in the DataSetName property in the Properties grid.
Groups
You can group the columns and rows in the matrix by opening the Property dialog, and on the Row Groups or Column Groups page, editing the Group on expression, or by dragging a field into the header cell.
You can nest column and row groups by right-clicking the UI above a column or to the left of row and choosing Add Column Group or Add Row Group, or simply by dragging another field onto the column or row into which you want to insert it.
To determine where new groups are displayed, when you drag a field into an existing group you can move the mouse up or down (for columns) or left or right (for rows) to nest the new group within the existing group, or to nest the existing group within the new group.
At run time, the nested group repeats within the original group. For instance, when you drag the City field from your dataset onto a header already grouped by Country, the report displays the first country with all of its cities, then the next country with all of its cities, and so on until all of the countries in the dataset are displayed with all of their cities.
Static Rows and Columns
To insert a static row or column, right-click the detail cell and choose Add Column or Add Row. This displays a column next to or a row above or below the existing one and adds another detail cell.
Aggregates
Groups in a matrix do not subtotal data by default. To add this functionality, right-click the group header and choose Subtotal. This adds a cell to the right of the column, or below the row. Subtotal cells have a green triangle in the upper right corner which allows you to select the subtotal and set its properties in the property grid. For more information, see Expressions.
Placement of Data
You can control where data is placed in several ways. You can change the Direction property of the matrix to RTL to cause dynamic column headers to expand left instead of right.
You can also move row headers to the right of the detail cells by changing the GroupsBeforeRowHeaders property of the matrix. The integer value you supply for this property equals the number of instances of the outermost column group that displays to the left of the row headers (or to the left if the Direction property is set to RTL).
Properties for the Matrix are available in the Matrix dialog. To open it, with the Matrix control selected on the report, under the Properties Panel, click the Property dialog link.
The Matrix dialog lets you set properties on the report control with the following pages.
Note: You can select <Expression...> within many of these properties to create an expression to determine the value.
General
Name: Enter a name for the matrix that is unique within the report. This name can be called in code.
Tooltip: Enter the value or expression you want to appear when a user hovers the cursor over the matrix in the viewer at run time.
Dataset name: Select a dataset to associate with the matrix. The combo box is populated with all of the datasets in the report's dataset collection.
Has own page numbering: Select to indicate whether this Matrix is in its own section with regards to pagination.
Page breaks: Select any of the following options to apply to each instance of the matrix.
Matrix column expand: Select the direction in which columns expand.
Groups before row headers: Select the number of columns to show before the row header columns begin. The default value of 0 displays the row header column to the left.
Visibility
Initial visibility
Visibility can be toggled by another report item: Select this check box to display a toggle image next to another report item. This enables the drop-down list where you can select the report control that users can click to show or hide this matrix.
Navigation
Document map label: Enter an expression to use as a label to represent this item in the table of contents (document map).
Bookmark ID: Enter an expression to use as a locator for this matrix. You will then be able to provide a bookmark link to this item from another report control using a Jump to bookmark action.
Filters
Click the plus sign button to add a filter to the matrix. Use the arrow and X buttons to move or delete filters. You need to provide three values to add a new filter to the collection: Expression, Operator, and Value.
Expression: Enter the expression to use for evaluating whether data should be included in the matrix.
Operator: Select from the following operators to decide how to compare the expression to the left with the value to the right.
Value: Enter a value to compare with the expression on the left based on the selected operator. For multiple values used with the Between operator, the lower two value boxes are enabled.
Values: When you choose the In operator, you can enter as many values as you need in this list.
Row Groups
The Row Groups page of the Matrix dialog allows you to add, remove, or change the order of row groups using the plus sign, X and arrow buttons.
Click the Add button to add a new row group to the list and set up information for each group on the following tabs.
General
Name: Enter a name for the group that is unique within the report. This property cannot be set until after a Group on expression is supplied.
Group on: Enter an expression to use for grouping the data.
Label: Enter an expression to identify an instance of the group for document map and search functions.
Parent group: For use in recursive hierarchies. Enter an expression to use as the parent group.
Filters
You need to provide three values to add a new filter to the collection: Expression, Operator, and Value.
Expression: Enter the expression to use for evaluating whether data should be included in the group.
Operator: Select from the following operators to decide how to compare the expression to the left with the value to the right.
Value: Enter a value to compare with the expression on the left based on the selected operator. For multiple values used with the Between operator, the lower two value boxes are enabled.
Values: When you choose the In operator, you can enter as many values as you need in this list.
Sorting
Click the plus sign button to enter new sort expressions, and remove them using the X button.
In the Expression box, enter an expression by which to sort the data in the group, and under Direction, select Ascending or Descending for the selected sort expression.
Visibility
Initial visibility
Visibility can be toggled by another report item: Select this check box to display a toggle image next to another report item. This enables the drop-down list where you can select the report control that users can click to show or hide this group.
Data Output
Element name: Enter a name to be used in the XML output for this group.
Collection: Enter a name to be used in the XML output for the collection of all instances of this group.
Output: Choose Yes or No to decide whether to include this group in the XML output.
Layout
Page break at start: Inserts a page break before the group.
Page break at end: Inserts a page break after the group.
Has own page numbering: Used in conjunction with the "Page Number in Section" and "Total Pages in Section" properties, tells the report that the group constitutes a new page numbering section.
Column Groups
The Column Groups page of the Matrix dialog allows you to add, remove, or change the order of row groups using the plus sign, X and arrow buttons.
Click the Add button to add a new column group to the list, and set up information for each group on the following tabs.
General
Name: Enter a name for the group that is unique within the report. This property cannot be set until after a Group on expression is supplied.
Group on: Enter an expression to use for grouping the data.
Label: Enter an expression to identify an instance of the group for document map and search functions.
Parent group: For use in recursive hierarchies. Enter an expression to use as the parent group.
Filters
You need to provide three values to add a new filter to the collection: Expression, Operator, and Value.
Expression: Enter the expression to use for evaluating whether data should be included in the group.
Operator: Select from the following operators to decide how to compare the expression to the left with the value to the right.
Value: Enter a value to compare with the expression on the left based on the selected operator. For multiple values used with the Between operator, the lower two value boxes are enabled.
Values: When you choose the In operator, you can enter as many values as you need in this list.
Sorting
Click the plus sign button to enter new sort expressions, and remove them using the X button.
In the Expression box, enter an expression by which to sort the data in the group, and under Direction, select Ascending or Descending for the selected sort expression.
Visibility
Initial visibility
Visibility can be toggled by another report item: Select this check box to display a toggle image next to another report item. The user can click the toggle item to show or hide this band group. This enables the drop-down list where you can select the report control that users can click to show or hide this group.
Data Output
Element name: Enter a name to be used in the XML output for this group.
Collection: Enter a name to be used in the XML output for the collection of all instances of this group.
Output: Choose Yes or No to decide whether to include this group in the XML output.
Data Output
Element name: Enter a name to be used in the XML output for this matrix.
Output: Choose Auto, Yes, or No to decide whether to include this matrix in the XML output. Choosing Auto exports the contents of the matrix.
Cell element name: Enter a name to be used in the XML output for the data element for the cell.
Cell element output: Choose Yes or No to decide whether to include the cell contents in the XML output.