Modify the Appearance of the Viewport
In This Topic
Viewport refers to the area on the map where map data is displayed against a geographical background. It specifies the coordinates, projection system, parallels and meridians, center point, and scale of the map. In other words, it is a map element that actually display geographical data and occupies most area of the map control depending on the location and dock position of other map elements. See Map for more information.
You can modify Viewport properties to make the map look more attractive.
- On the , select the Map control.
- Go to the Properties window, click the Viewport property and then click the ellipsis (...) button that appears.
- In the Map Viewport dialog that appears, on the General page, choose the Coordinate system. The map viewport supports the following two coordinate system:
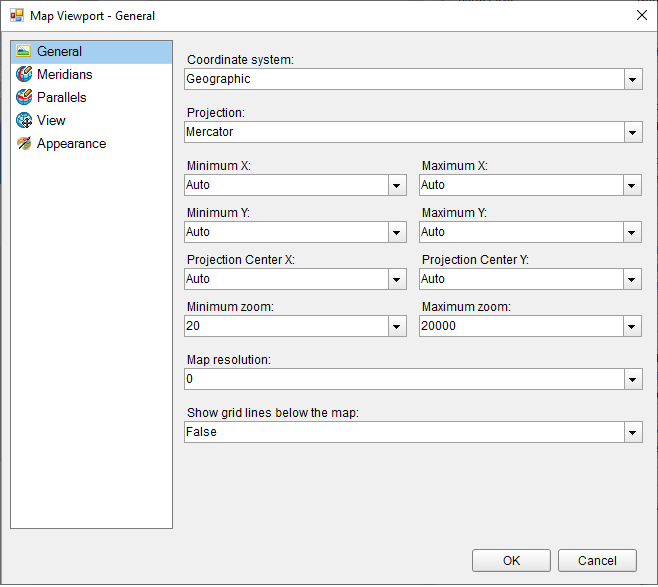
- Geographic: Specifies Earth coordinates by defining longitude and latitude values. If you set the CoordinateSystem property to Geographic, then you must specify the Projection property. A projection is a set of rules on how to locate three-dimensional objects onto a planar surface.
- Planar: Specifies geometric coordinates on a two-dimensional surface by using X and Y values. and in case you set it to Geographic then set the Projection.
- Go to the Meridians page, set its visibility and its line and font style and color.
- Similarly, go to the Parallels page, set its visibility and its line and font style and color.
- On the View page of the dialog, choose a Center and Zoom mode. The map viewport supports the following four center and zoom modes:
- Custom: Choose this option to specify custom values for the view center and the zoom level.
- Center map to show a map layer: Choose this option to specify a layer and automatically, center the view on its map data. For example, center the view on LineLayer1.
- Center map to show a map element: Choose this option to center the view on a specific data bound map element. For example, center the view on the map element where the name of the match field is [StateName] and the match value is "Washington".
- Center map to show all map elements: Choose this option to center the view on all map elements in the layer.
Note: Zoom and View Center level can also be set from the using the zoom slider and arrow keys that appears in the of the Map control.
- On the Appearance page, set the Border and Background style and color of the viewport.
-
Click OK to close the dialog.