Multiplot charts have a common X axis with the Y axis displaying different values. Some of the most common combinations of plots in a chart are:
To compare data points between two plots, you can use the following functions, available in the Expression Editor (Plot > Rule > Condition):
CurrentValue - represents the current value of a data point on specified plot.
Example: =CurrentValue("plot1"); =CurrentValue("plot1","high");
NextValue - represents the data point value next to current value on specified plot.
Example: =NextValue("plot1"); =NextValue("plot1","high");
PreviousValue - represents the data point value previous to current value on specified plot.
Example: =PreviousValue("plot1"); =PreviousValue("plot1","high");
Note: The second argument in the examples above is optional and is required only in a Financial or Gantt chart. Supported values are high, low, open, close, lower, upper.
Let's look at some multiplot chart examples.
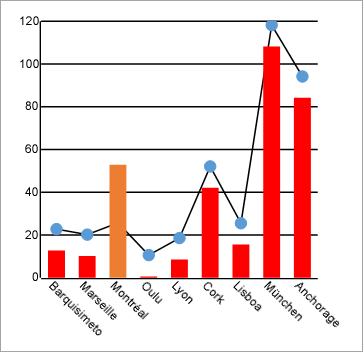
This chart has two plots (Line and Column) with the Ship City category data. The chart's Plot2 has the Rules >Rule1 set as follows in the RuleDesignerCollectionEditor:
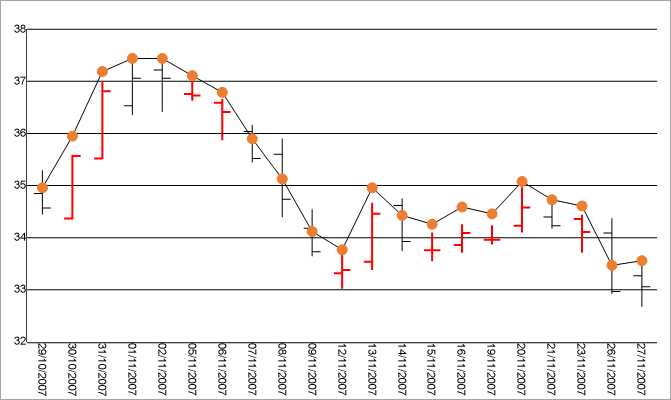
This chart has two plots (High Low Open Close and Line) with the DateTime category data. The chart's Plot1 has the Rules >Rule1 set as follows in the RuleDesignerCollectionEditor:
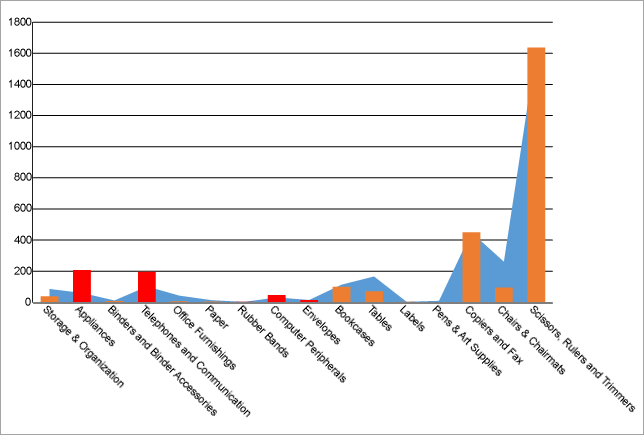
This chart has two plots (Area and Column) with the Product Line category data. The chart's Plot2 has the Rules >Rule1 set as follows in the RuleDesignerCollectionEditor: