Point or Bubble charts represent data by means of points and bubbles.
The ActiveReports Chart control can draw a number of point/bubble chart types, like, Bubble, BubbleXY, PlotXY, and Scatter.
Given below is the list of 2D charts that fall under the Point/Bubble Chart category.
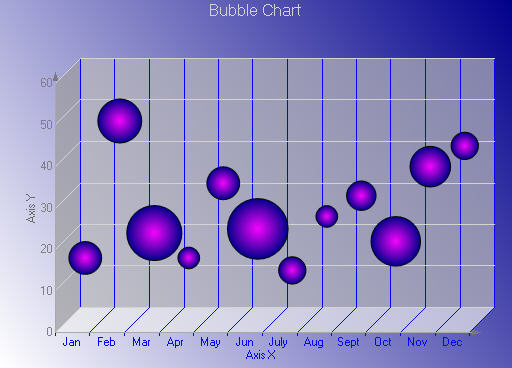
The Bubble chart is an XY chart in which bubbles represent data points. The first Y value is used to plot the bubble along the Y axis, and the second Y value is used to set the size of the bubble. The bubble shape can be changed using the series Shape property.
The Bubble XY chart is an XY chart in which bubbles represent data points. The BubbleXY uses a numerical X axis and plots the x values and first set of Y values on the chart. The second Y value is used to set the size of the bubble.
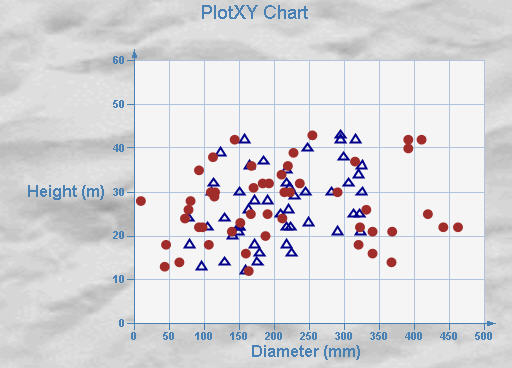
A plot XY chart shows the relationships between numeric values in two or more series sets of XY values.
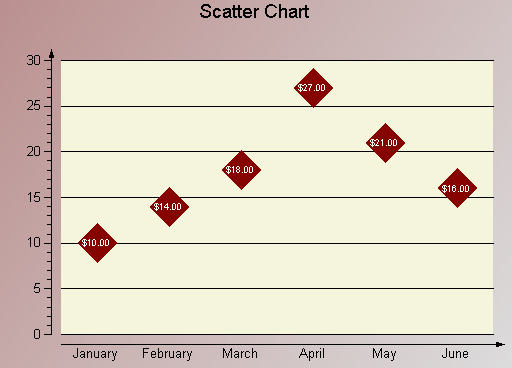
Use a scatter chart to compare values across categories.