In This Topic
You can dynamically control the chart appearance by creating a rule or several rules for each plot and specifying the background color, line color, line style, line width, and other elements of the chart visual presentation at rendering.
A rule consists of a condition - an expression that specifies how to apply a target property, and a target property - a chart element that you can change.
Add a rule
- Select a Chart plot.
- In the Properties window, go to the Rules property and click (Collection).
- In the RuleDesigner Collection Editor that opens, click Add to add a new rule.
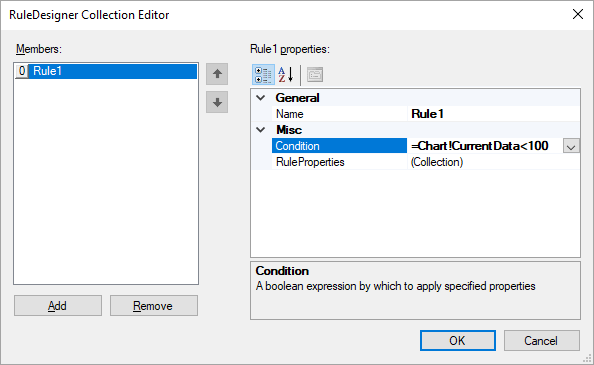
- In the Condition field, specify a condition expression for a target property.
- In the RuleProperties field, click (Collection).
- In the RulePropertyDesigner that opens, click Add to add a target property.
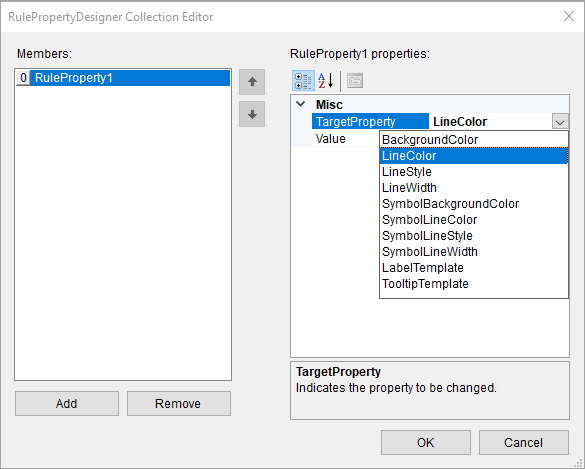
- In the TargetProperty field, select a property from the pre-defined list of properties - e.g. LineColor.
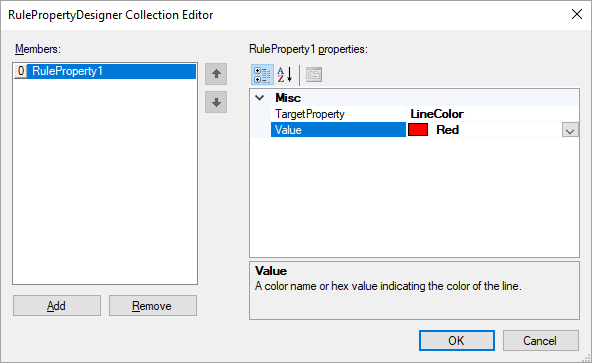
- In the Value field, select a value of the target property.
- Click OK.