What's New in ActiveReports v15
ActiveReports v15.2 - September 14, 2021
GrapeCity is pleased to announce the release of ActiveReports 15.2, the second service pack of ActiveReports 15. This release includes enhancements, bug fixes, as well as requested features.
- A new TXT export for Page/RDL Reports
- Report Explorer customization in the Desktop End User Report Designer
- Localizing Page/RDL charts at runtime
- Web Report Designer events
ActiveReports v15.1 - April 27, 2021
Section Reports on Linux
We have supported Page and RDL report deployment to Linux since ActiveReports 14. Section Report, however, was supported on .NET Core/.NET 5, but they required a Windows host due to reliance on GDI rendering. With this release, we've made several enhancements to the Section Reports rendering engine that would allow you to deploy your application to a Linux server.
The most important change was using a new "GcDoc" rendering. This allows you to deploy your ASP.NET Core or ASP.NET 5 applications to Linux environments. All of the common features and controls are supported. You can either display your reports in the ActiveReports' lightweight JSViewer component, or export them to PDF, TXT, or TIFF formats.
A few notes to keep in mind:
- Compile in Cross-Platform Compatibility mode as GDI Compatibility is not supported
- libgdiplus installation is required on the host
- WinForms and WPF viewers and designers are currently not supported
- Direct printing and printer settings are currently not supported
- Custom Controls, OLE objects, OLEDB data sources, and metafile images are not supported
- RichTextBox supports HTML rendering
- Excel and RTF exports are currently not supported
Custom Font Resolving
As you know, with fundamental differences between them, Windows and Linux operating systems have limitations and features that are not supported by the other. The use of custom fonts is one such example. Continuing our dedication to WYSIWYG reporting, in this release we give you the ability to pass custom fonts via an API so your Page, RDL, and Section Reports display with the right fonts on Linux:
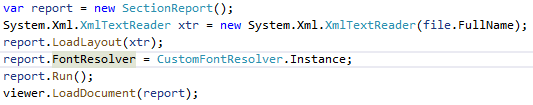
This code uses a CustomFontResolver.cs class to register a custom font and pass it to the section report via the FontResolver API.
JSViewer Performance Improvement
We've drastically improved the rendering speed in HTML export. By building the layout and exporting each report page in parallel, we are able to achieve impressive results, with load times at almost 50%.
| StreaminEnabled = Previous (in ms) | StreaminEnabled = Now (in ms) | ||
| 35,714 (1,824 pages) | 10863.55 | 6450.81 | -40.62% |
| 10,581 records (918 pages) | 7156.45 | 4058.1 | -43.29% |
| 832 Pages of Invoices | 4880.54 | 2478.18 | -49.22% |
| Complex Layout (447 pages) | 9689.37 | 5994.43 | -38.13% |
PDF/UA Enhancements
Previously, when using the Read Aloud feature of PDF Readers like Adobe Acrobat, images in accessible PDFs were read as the name the control, such as "Picture 1". In an effort to make PDF documents more accessible, we've added a new 'Title' property to the Image control:
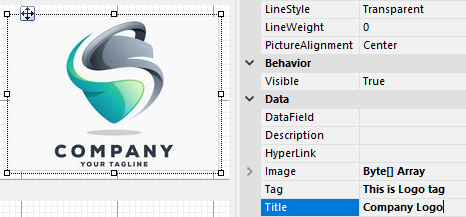
Now, when the PDF reader reads your PDF/UA outputs, it will read the Title then control type. In this case, it will say, "Company Logo, picture."
Charts Enhancements
In this release of ActiveReports, we have added a couple of valuable features to our chart library.
Conditional Formatting in Charts
You can now use expressions in charts to conditionally change the text or appearance of Chart labels, tooltips, and data points. For example, imagine you want to conditionally format a chart to show any data points below a certain threshold in red:
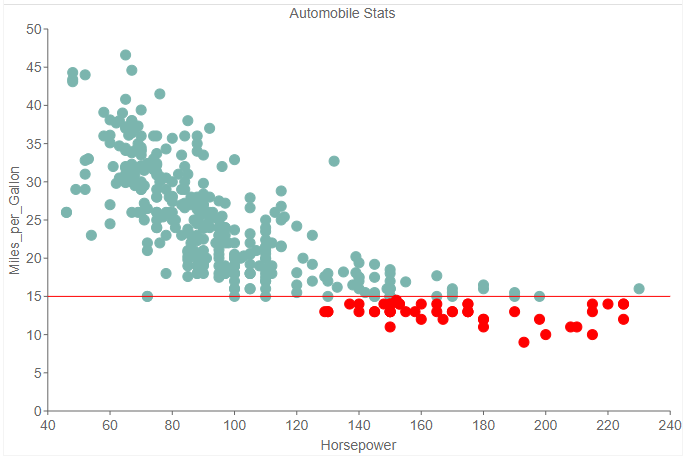
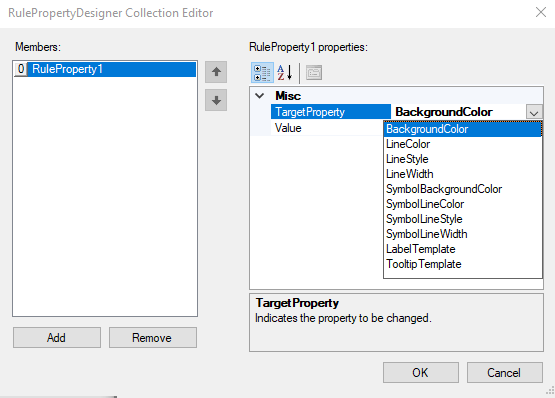
You can do this by opening the RuleDesigner Editor from the Charts Plot > Configuration > Rules property. For the Condition, enter an expression, such as =Chart!CurrentData<15. Then click the Rule ellipses to open the RulePropertyDesigner dialog box. Here you can set any number of rules for the various properties of the plot.
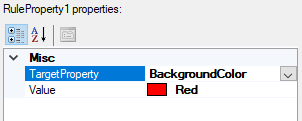
For our purposes, we will set the BackgroundColor to red. However, you can add more rules to the same condition to change the series label, tooltip, or other properties.
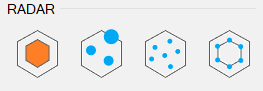
Radar Chart Template
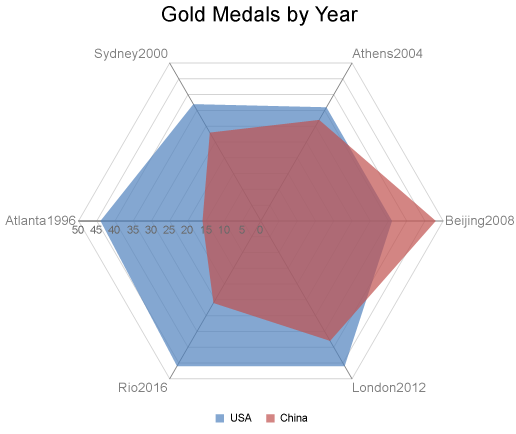
In this release, we've added the Radar Chart template. Radar charts, also known as Spider charts, are a great way to display multivariate data in a two-dimensional visualization. Typically, Radar charts would have three or more qualitative variables.
In our case, they are Number Gold Medals, Country, and Year. When creating a Radar chart, you can select one of four plot types: Area, Bubble, Scatter, Line.
Extended Page Break Properties
With Page and RDL reports, you have more page break options when grouping in a data region such as a Table.
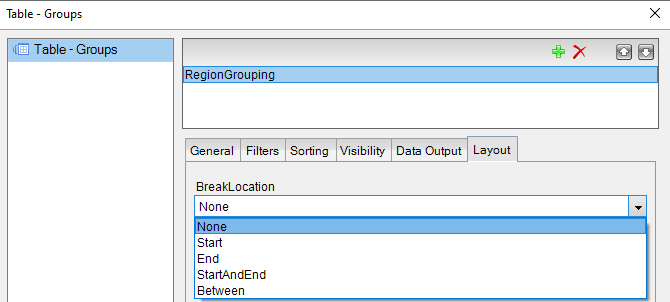
These options give you advanced control over the rendering of each group on the page. For example, if you have a table grouped on a Region and you need to print each region on an odd page, set the BreakLocation option to StartAndEnd.
Dynamic Table Column Widths
This is a customer-requested feature. Imagine that you have a Table in your report and you want to hide one or more columns based on a condition. While this has always been possible to do with ActiveReports using expressions, table width would shrink when columns were hidden. To address this, we added a new property, AutoWidth, to the Table control's column property.
Setting this property to Proportional renders a much cleaner table that maintains its original size by automatically expanding the column's width to account for the empty space left by the hidden column.
ActiveReports v15 - December 18, 2020
New .NET 5 Controls for Reporting
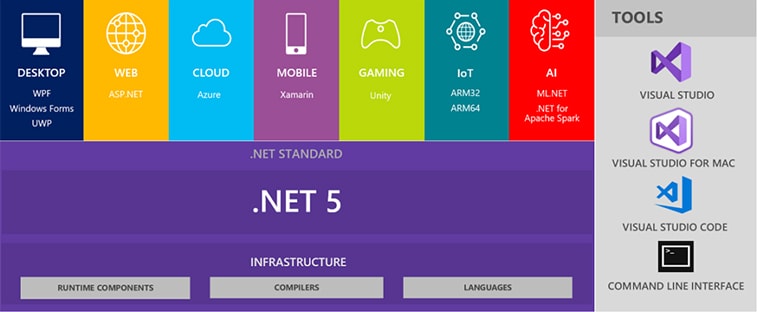
source: Microsoft
As you know, .NET 5 is the next version of .NET Core. It is Microsoft's first release to unify the .NET platforms and was released last month. We can expect at least three more major releases over the next few years, with .NET 6 and 8 offering LTS (Long-Term Support). The release of .NET 5, aside from starting to unify the .NET universe, brought many features, including Single-File Apps to distribute applications as a single exe, performance improvements including a garbage collector and JIT enhancements, and Blazor Server and WebAssembly improvements, among others.
To get started with ActiveReports on .NET 5, you will need Visual Studio 16.8 or later, obviously with .NET 5 installed. Run the ActiveReports installer to install the necessary tools and integrate it with Visual Studio 2019.
At this point, you can either create a new application or upgrade an existing application to .NET 5. To create a new application with ActiveReports, and Microsoft certainly recommends targeting .NET 5 for new projects, you can either start a new blank project or use one of the pre-built project templates ActiveReports provides:
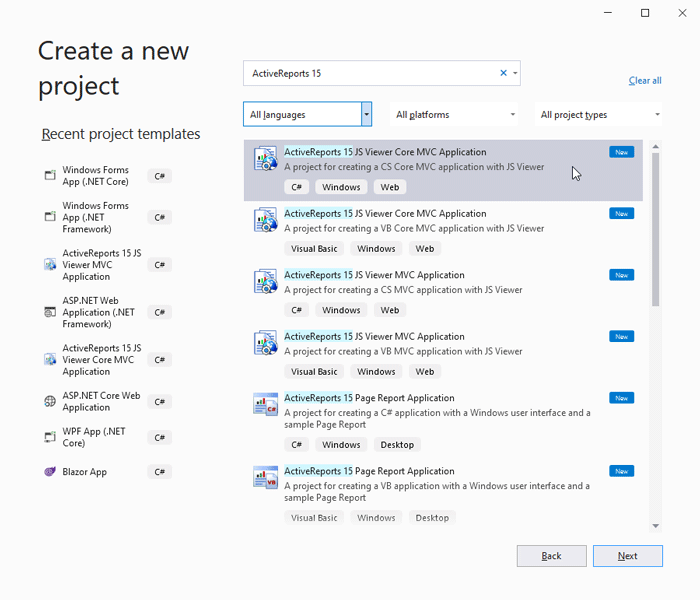
If you have an existing application, upgrading it from .NET Core to .NET 5 is relatively simple. See this page for a step by step guide on migrating the project. ActiveReports, for its part, requires nothing beyond that to work in .NET 5.
Report Designer for Web Enhancements
The following are new features and enhancements introduced in the End-User Report Designer for web:
Table Control Simplifications
Creating a WYSIWYG tabular report in the End-User Report Designer for the web has been dramatically simplified in ActiveReports v15. In this release, you can create a table from a dataset by dragging the dataset to the design surface. Alternatively, if you need a table made from only some of the fields, you can select the data fields of interest and drag-and-drop them to the design surface to create a table. This action saves so much time and effort instead of dropping a table from the toolbox, adding the necessary number of columns, and then assigning a data field to each column.
Another significant enhancement is re-arranging Table columns at design time. Imagine you've added several fields to the design surface and the designer automatically created a table out of those fields. Now, you want to reorder the fields, so Column1 comes between Column4 and Column5. You can do this by simply dragging Column1 to the desired position. You can move multiple columns the same way by selecting them using Ctrl+mouse_click. So much easier, especially for non-technical users.
Tablix Wizard
Creating a report based on the Tablix control is even easier in ActiveReports 15 with the new Tablix Wizard. You can see that the wizard offers an Office-inspired UI to make it more user-friendly:
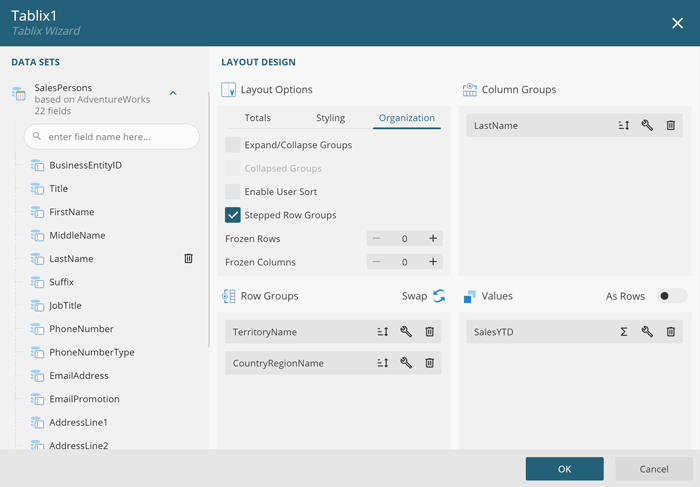
The wizard features drag-and-drop functionality allowing you to drop fields from your data set (left panel) to either the Column Group, Row Group, or Values sections. Placing a field under Values will automatically apply the appropriate aggregate, which can be changed by clicking the sigma Σ icon for that field.
Additionally, aside from adding totals to groups and specifying styles, the Layout Options section has advanced features to help you better organize your data. For example, the Stepped Row Groups toggles between nested hierarchical grouping and side-by-side parent-child grouping.
Improved Syntax for Expressions
Reading expressions is now much simpler in ActiveReports v15! Expressions are like simple scripts that not only allow you to control the runtime behavior and appearance of a control but are also used for conditional formatting, aggregation, and more. For example, in previous versions of ActiveReports, to calculate the average price of products, you would use something like =Avg(Fields!Price.Value). The same expression would be {Avg(Price)}, which is much neater and easier to understand.
Advanced Parameters Options
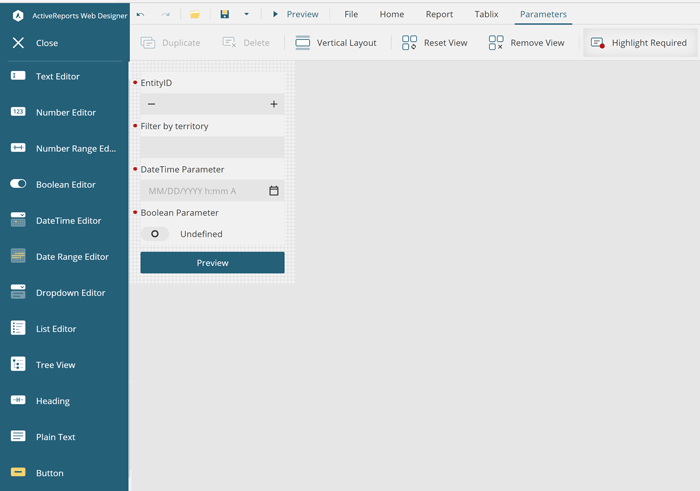
ActiveReports v15 gives you the ability to define custom parameter options using advanced control types. You can design the look and feel of the parameters your end users will interact with. For example, you might display a date parameter as a calendar or a drop-down, or even a date range. You can even allow your end-users to customize parameter layouts, similar to customizing a report layout. With all the options available, you can design a very advanced and complex parameter panel. And with our extensive API, you can disable parameter customization for end-users if you so choose.
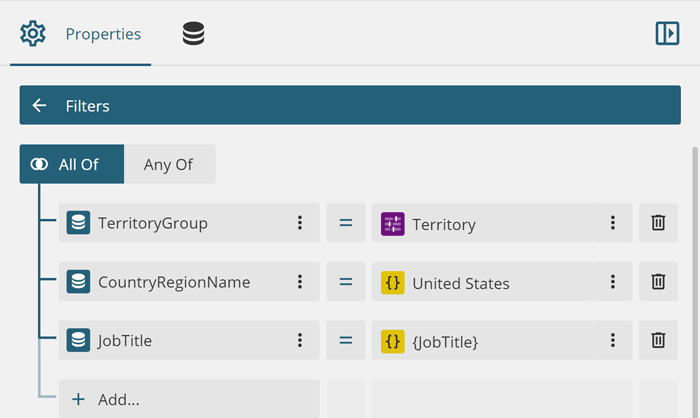
Advanced Filtering
A final feature for the End-User Report Designer for the web is the Advanced Filters. Similar to the advanced parameter customizations discussed above, you can also create advanced filters to filter your data at the dataset level or apply different filters to specific data regions or controls. The objective of this feature was to make the data filtering process simpler and straightforward. Therefore, we created a simple, uncomplicated UI to help you create complex AND / OR logic-based filters, depending on a parameter value, a specified string, or some other condition.
New Page Height setting for RDL reports

We added an "Auto" setting for the PageSize.Height property for RDL reports so print jobs can be better managed for reports whose length is unknown. Imagine a scenario where you need to print a lengthy report on a scroll of paper, similar to a retail store's receipt. While this was possible using calculations at runtime, it was a bit cumbersome. Now, if you need to print reports of unknown height, set the PageSize.Height property to "Auto."
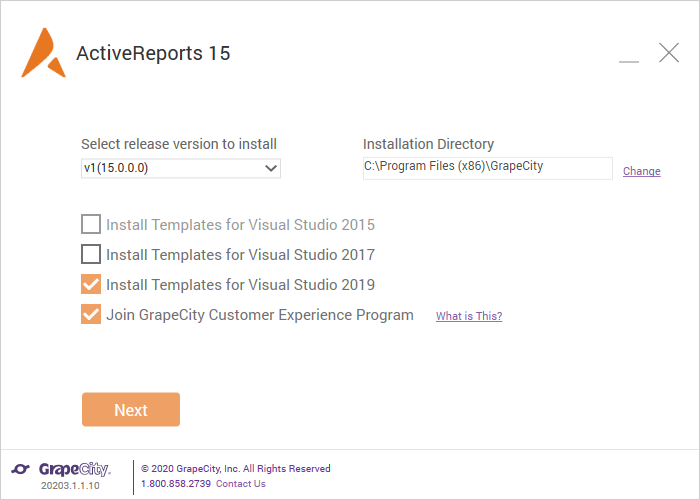
New Installer
With ActiveReports v15, we've improved the installation process. First, the installer is now a much smaller executable that determines which files are needed for the installation and gives you control over where you want them installed. As with previous versions of ActiveReports, samples are not installed on your machine as they are readily available on GitHub. I'm excited about this next one: the executable offers you the option to join the GrapeCity Customer Experience Program, which sends us information specific to GrapeCity's controls and libraries. This information is then used to address issues within the product and improve usability and quality. No personal information or application-specific information is collected. As such, we will learn which ActiveReports controls and features you use most often to focus more development resources on those features and help you achieve more in less time.
Updates for ActiveReports v15
ActiveReports v15.2 - September 14, 2021
ActiveReports v15.1 - April 27, 2021
ActiveReports v15 - December 18, 2020
Related Links