Charts have always been an important component which gives the flexibility to analyze and visualize data. On great demand of Spread customers, we have introduced Charts in Spread for Silverlight and WPF. The charts can be embedded in Spread sheet directly for better visualization of data. An important feature of Spread Charts is that it supports MS Excel. The Excel sheets including charts can now be imported to and exported from Spread. Charts for Spread inlcudes 30+ widely used 2D and 3D Chart types like: Column, Line, Pie, Bar, Area, Bubble, Scatter, Radar, Stock, 3D Surface etc. 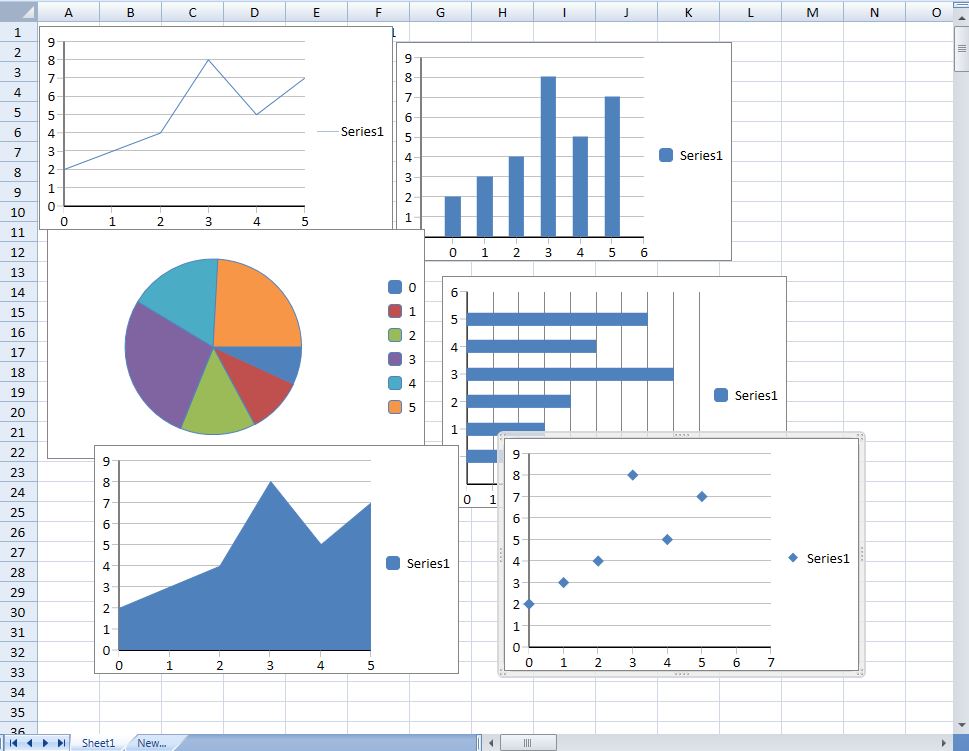

Creating Charts using Designer
Creating charts in Spread Designer is pretty simple similar to MS Excel. We just need to set the chart type and choose data. The resultant chart can be previewed simultaneously.
Creating Charts in Code
For creating charts dynamically, we need to instantiate a SpreadChart class object and add it to the SpreadSheet. The constructor call to create a SpreadChart instance would be similar to : Dim instance As New SpreadChart(name, type, itemsFormula, nameFormula, dataFormula, x, y, width, height).
GrapeCity.Windows.SpreadSheet.Data.SpreadChart chart = new GrapeCity.Windows.SpreadSheet.Data.SpreadChart("Chart", GrapeCity.Windows.SpreadSheet.Data.SpreadChartType.ColumnStacked, "Sheet1!$A$1:$A$7", 0,0, 200, 200);
//add this chart to SpreadSheet
gcSpreadSheet1.ActiveSheet.Charts.Add(chart);
Download Spread's Studio for .Net and explore our new Spread Charts for Silverlight and WPF

MESCIUS inc.