FlexPivot: Create Views in a Pivot Table
With FlexPivot, you can connect to a data source, run your application, and create views to summarize. Dynamic, drag-and-drop data manipulation helps you get the best understanding of your data. Context is critical to complex data. Being able to change context quickly, and gain a new perspective on your data, is just as critical. For more information on connecting FlexPivot to a data source, see the documentation, or FlexPivot: DataBinding to C1DataEngine or to a Data Source.
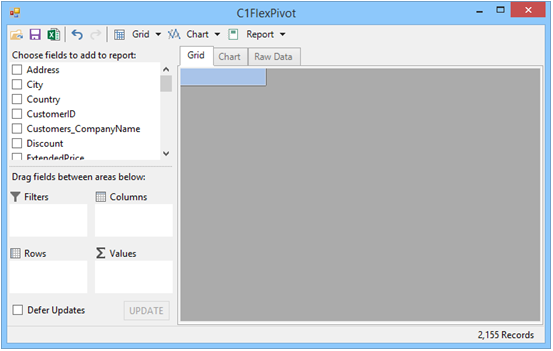
- Press F5 to run your FlexPivot application.
- On the left side of your application, you'll see the available fields:
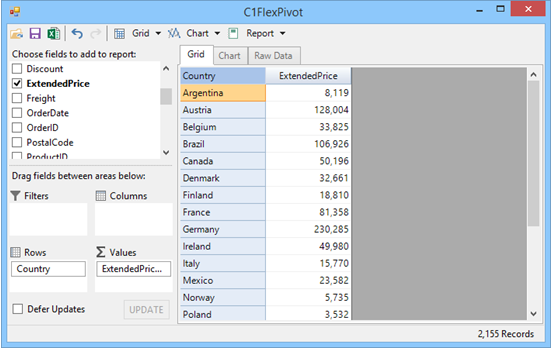
- To fill your grid with data, drag Country from the fields list to the Rows list below. Find Extended Price in the fields list, as well, and drag that to the Values list.
- Your grid will fill with data, showing the Extended Price for each Country:
- Select the Chart tab to view your selected data in a chart:
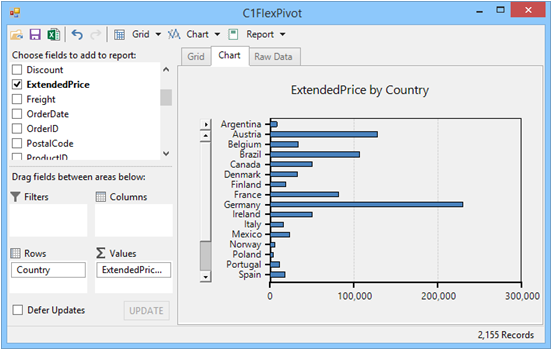 You can see that most sales come from Germany, but who makes them?
 - To give your data better context, drag Salesperson from the fields list to the Columns list. The Extended Price is shown for each Country and Salesperson:

- To find the top Salesperson, swap the Salesperson and Country fields by dragging Country to the Columns field and Salespeson to the Rows field)
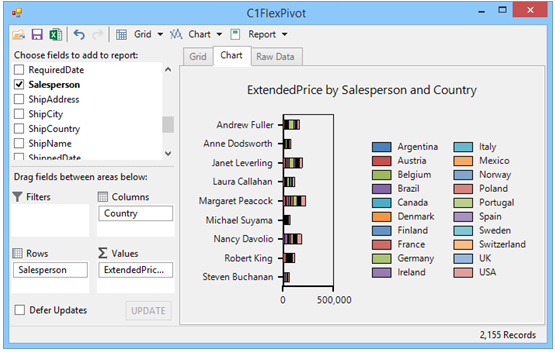 From the new chart, you can see that Margaret Peacock is the top salesperson.


The data we used for this post is simple. You may need more customization options for complex data. FlexPivot allows you to customize your view according to your data needs. For more information, check out the documentation »

MESCIUS inc.