Wijmo's PivotEngine class can generate fields automatically based on the data in its itemsSource property. This is a useful feature when you are dealing with generic/unknown data.
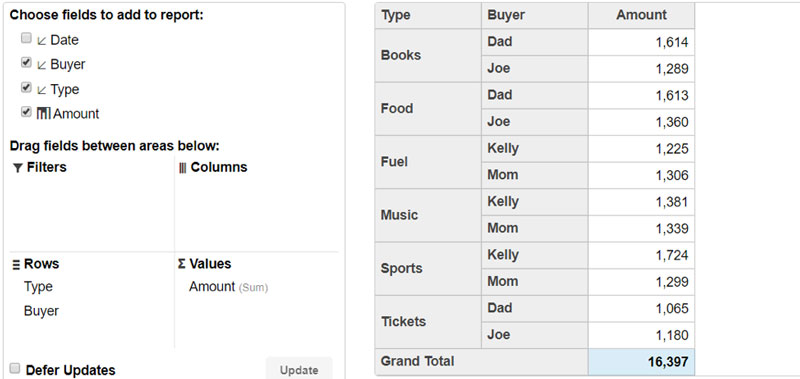
For example, here is a PivotPanel populated automatically from a data source:
var ng1 = new PivotEngine({
    itemsSource: getData(),
    valueFields: ['Amount'],
    rowFields: ['Type', 'Buyer']
});
This works fine, but in most cases, you know the type of objects you are analyzing.
You can take advantage of that to specify the list of fields to show to the user. This allows you to customize the list, including which fields you want to show, the order they appear in, their captions, default aggregation mode, format, etc.
For example, here is a PivotPanel populated using an explicit list of fields:
var ng2 = new PivotEngine({
    itemsSource: data,
    fields: [
        { binding: 'buyer', header: 'Buyer' },
        { binding: 'type', header: 'Type' },
        { binding: 'date', header: 'Date' },
        { binding: 'date', header: 'Year', format: 'yyyy' },
        { binding: 'date', header: 'Quarter', format: 'Q' },
        { binding: 'date', header: 'Month', format: 'MMM' },
        { binding: 'amount', header: 'Amount', format: 'c2' }
    ],
    valueFields: ['Amount'],
    rowFields: ['Type', 'Year', 'Quarter']
});
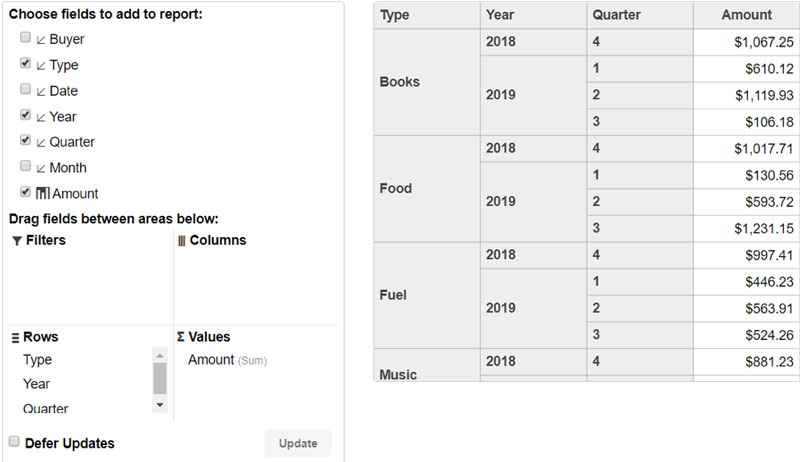
By setting the fields property, we were able to define the order of the fields, add formatting to the "Amount" field, and create three extra fields bound to the "date" value and configured to show the year, quarter, and month.
The extra date fields increased our field count from four to seven. This is still a relatively small number, but it can grow quickly. And with large numbers of fields, it is often a good idea to organize the list hierarchically.
Field groups are fields without a binding and with a subFields array that contains regular fields (or other field groups). Field groups are shown in the PivotPanel as collapsible items, so users can close groups they are not interested in.
For example, here is a PivotPanel populated using a hierarchical field list:
var ng3 = new PivotEngine({
    itemsSource: data,
    fields: [
        { header: 'Dimensions', subFields: [
            { binding: 'buyer', header: 'Buyer' },
            { binding: 'type', header: 'Type' },
            { header: 'Date', subFields: [
                { binding: 'date', header: 'Year', format: 'yyyy' },
                { binding: 'date', header: 'Quarter', format: 'Q' },
                { binding: 'date', header: 'Month', format: 'MMM' },
            ]},
        ]},
        { header: 'Measures', subFields: [
            { binding: 'amount', header: 'Amount', format: 'c2' }
        ]}
    ],
    valueFields: ['Amount'],
    rowFields: ['Type', 'Year', 'Quarter']
});
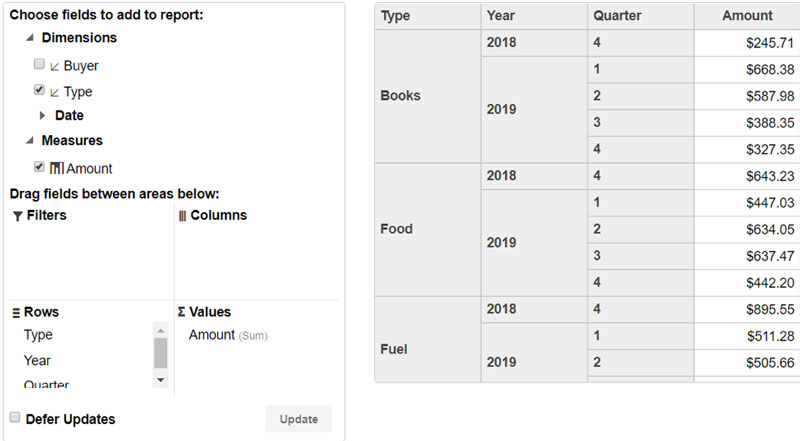
Now the field list has three collapsible groups: "Dimensions," "Date," and "Measures." Groups make it easier for users to understand and navigate field lists.
This is a very simple example, but actual scenarios often involve data sources with hundreds of fields. That's when hierarchical lists can make a big difference.

Bernardo de Castilho