Pivot Tables are undeniably one of the most powerful data analysis tools; they help organize data so users can detect recurring patterns more easily. Pivot Tables help users create customized tables from large data groups. Using pivot functionalities, the user can summarize, sort, reorganize, group, count, total, or average data effortlessly within a table.
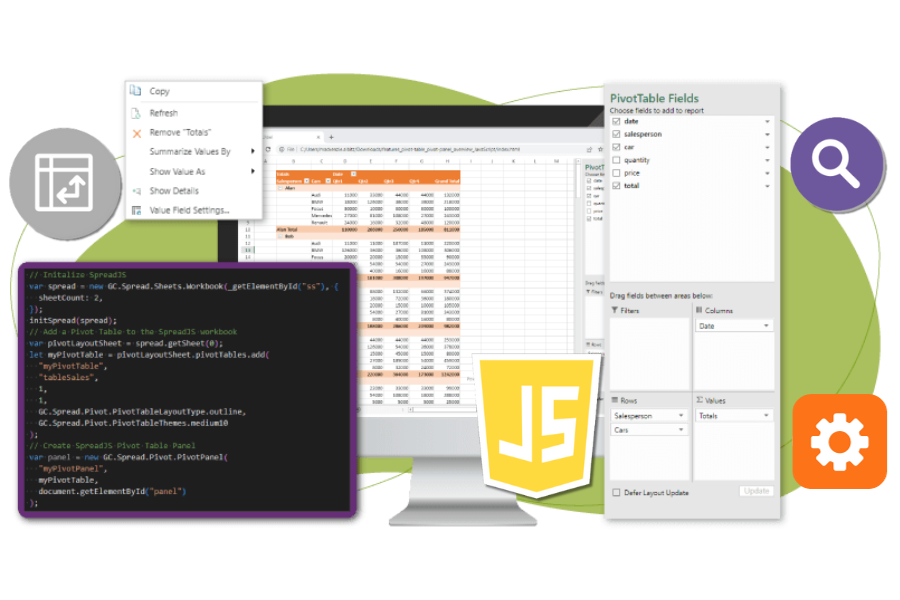
SpreadJS, a JavaScript spreadsheet component, has a Pivot Tables add-on feature that allows JavaScript developers to create Excel-like Pivot Tables programmatically in their applications or allow end-users to create them easily with a familiar UI.
Ready to Get Started? Download a free trial of SpreadJS today!
This blog will go through some of the essential properties and features of the JavaScript spreadsheet Pivot Table API that will help you customize the appearance of your pivot tables and reports derived from these Pivot Tables.
-
Create a JavaScript Pivot Table
-
Pivot Layout
-
Pivot Table Collapsing and Grouping
-
Pivot Table Theme
-
Pivot Styles
-
Pivot Table AutofitColumn
-
Pivot Table Slicers
-
Pivot ContextMenu
-
Pivot Conditional Formatting
-
-
Benefits
-
Interactive Data Analysis
-
FinTech
-
Marketing
-
Budgeting
-
You can download a sample application to follow along with the blog.
Create a JavaScript Pivot Table
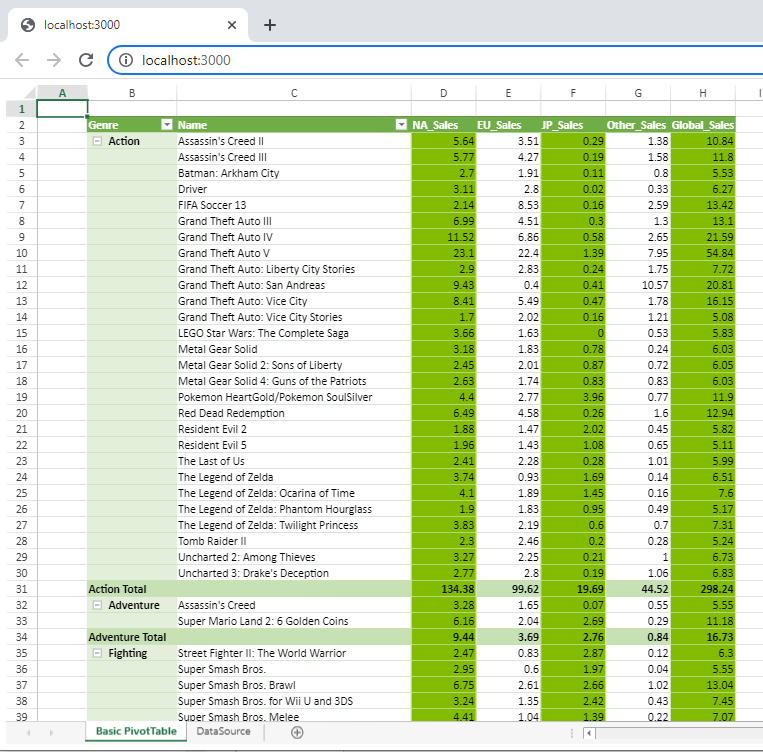
Imagine having countless rows of data containing specific information. For example, in the datasheet below, we have a large number of records showing the best-selling video games.
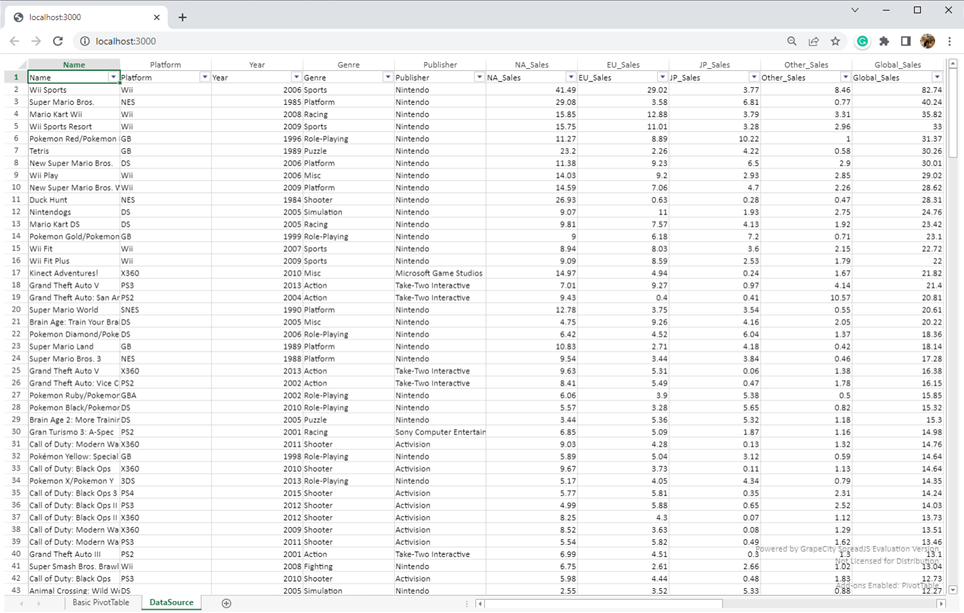
The goal is to create a report summarizing this raw data into more insightful information. The below function shows how to programmatically add a pivot table and add fields in a JavaScript application using SpreadJS’s PivotTable class API.
function initPivotTable(sheet, tableName) {
    sheet.name("Basic PivotTable");
    sheet.setRowCount(250);
    let pivotTableOptions = {bandRows:true,bandColumns:true};
    // Create Pivot Table
    let pivotTable = sheet.pivotTables.add("PivotTable", tableName, 1, 1, GC.Spread.Pivot.PivotTableLayoutType.tabular, GC.Spread.Pivot.PivotTableThemes.medium14, pivotTableOptions);
    pivotTable.suspendLayout();

    pivotTable.add("Genre", "Genre", GC.Spread.Pivot.PivotTableFieldType.rowField);
    pivotTable.add("Name", "Name", GC.Spread.Pivot.PivotTableFieldType.rowField);
    pivotTable.add("NA_Sales", "NA_Sales", GC.Spread.Pivot.PivotTableFieldType.valueField, GC.Pivot.SubtotalType.sum);
    pivotTable.add("EU_Sales", "EU_Sales", GC.Spread.Pivot.PivotTableFieldType.valueField, GC.Pivot.SubtotalType.sum);
    pivotTable.add("JP_Sales", "JP_Sales", GC.Spread.Pivot.PivotTableFieldType.valueField, GC.Pivot.SubtotalType.sum);
    pivotTable.add("Other_Sales", "Other_Sales", GC.Spread.Pivot.PivotTableFieldType.valueField, GC.Pivot.SubtotalType.sum);
    pivotTable.add("Global_Sales", "Global_Sales", GC.Spread.Pivot.PivotTableFieldType.valueField, GC.Pivot.SubtotalType.sum);

    pivotTable.resumeLayout();
}
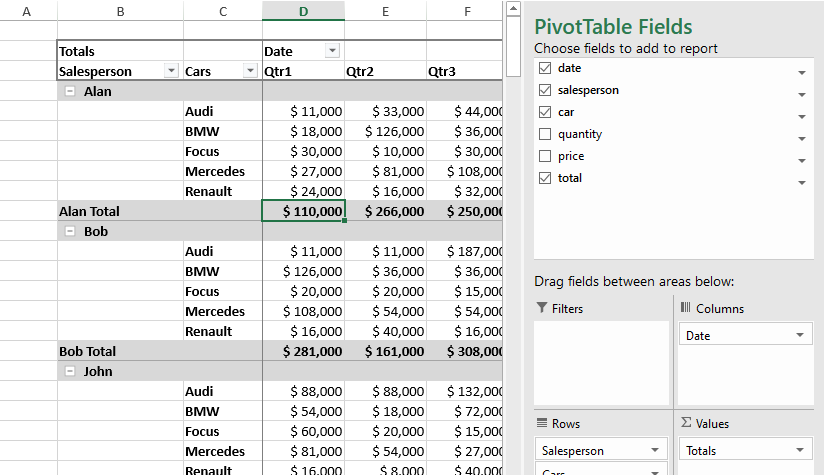
Another way of creating a pivot table is by using the Pivot Panel offered by SpreadJS. To initialize the Pivot Panel, first, create a DOM element in the HTML file, in this case, a DIV with an ID “panel”:
<body>
    <div class="sample-tutorial">
        <div id="ss" class="sample-spreadsheets"></div>
        <div class="sample-panel">
            <div id="panel"></div>
        </div>
    </div>
</body>
Apply CSS for the side panel in the styles.css file. Interesting side note - developers can customize the styling and appearance of the Pivot Panel here through the CSS:
.sample-panel {
  float: right;
  width: 300px;
  padding: 12px;
  height: 100%;
  box-sizing: border-box;
  background: #fbfbfb;
  overflow: auto;
}

.gc-panel {
  padding: 10px;
  background-color: rgb(230, 230, 230);
}

#panel {
  position: absolute;
  right: 0;
  width: 300px;
  height: 100%;
  top: 0;
}
Then, use SpreadJS’s PivotPanel constructor to initialize the panel:
//code to add pivot panel in the working spreadsheet.
var panel = new GC.Spread.Pivot.PivotPanel("myPivotPanel", myPivotTable, document.getElementById("panel"));
The application will now display the SpreadJS PivotTable with the side panel, allowing end-users to drag and drop needed fields according to the report logic.

Pivot Layout
SpreadJS allows you to choose from three different pivot table layouts to offer different visualizations of your data. This includes the Compact, Outline, and Tabular form layouts. By default, the pivot table layout is Compact form. Still, users can set the layout when creating the pivot table using the PivotTable constructor or change the layout using the layoutType function. The function has an integer argument corresponding to the form layout (0 - compact, 1 - outline, 2 - tabular).
// Set an outline form (1)
pivotTable.layoutType(1);
Compact Form (0)
This layout contains all the Row fields in one column in a hierarchical structure.
This layout form optimizes readability by keeping related data in one column. Still, if you copy and paste the data into a new worksheet, it will be harder to do further analysis.

Outline Form (1)
This layout has a hierarchical structure, but each Row field is in a separate column in the pivot table. It displays one column per field and provides space for field headers.
Using this form, you can include Field headers in each column, repeat all item labels, and reuse the data of the Pivot Table in a new location for further analysis. Still, this form uses horizontal space, so it might not be beneficial to use it in some cases.

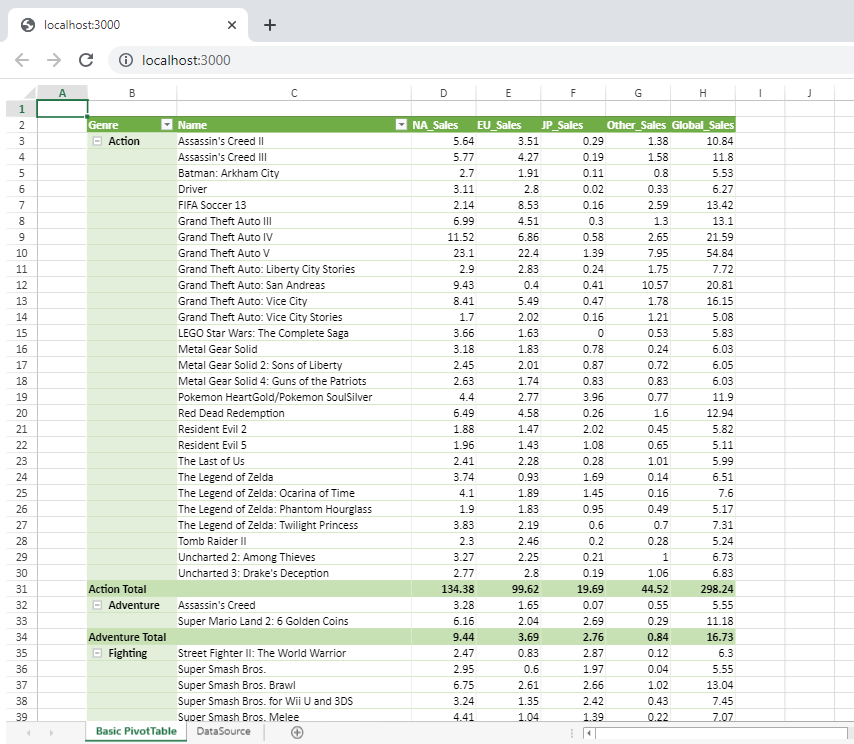
Tabular Form (2)
This layout is a hierarchical structure, and each Row field is in a separate column in the pivot table. It can display subtotals at the top of every group because items in the next column are displayed in one row below the current item.
This traditional table format includes Field headers in each column. It allows you to repeat all the item labels and reuse the Pivot Table data in a new location for further analysis. As a disadvantage, this layout uses horizontal space, and subtotals can’t be shown at the top of the group.
Pivot Table Collapsing and Grouping
SpreadJS supports pivot table grouping and collapsing to view data more easily. Users can set the collapse info for a specified field of the pivot table by the field name using the collapse method.
Users can also group dates, numbers, and text fields. Please look below to see how to collapse a field and break down the different grouping and ungrouping techniques supported with SpreadJS by using the group and ungroup method.
Collapse
To collapse a field, use SpreadJS' collapse method and indicate the target field's name and the collapsed item's name. The example shows a variety of listening regions collapsed.
spread.suspendPaint();
    let isCollapse = false;
    if(e.target.checked){
        isCollapse = true;
    }
    pivotTable.collapse("region","Africa",isCollapse);
    pivotTable.collapse("region","Asia",isCollapse);
    pivotTable.collapse("region","Australia",isCollapse);
    pivotTable.collapse("region","Europe",isCollapse);
    pivotTable.collapse("region","North America",isCollapse);
    pivotTable.collapse("region","South America",isCollapse);
    spread.resumePaint();
});
Notice that when selected, all of the specified fields are collapsed–making the data easier to view:

Grouping Dates
When grouping dates with SpreadJS, users can indicate the DateGroupType by hours, days, quarters, years, and more. For example, if a user wants to group their dates by quarters and years, they could use dateGroups and initialize the new groupInfo like so:
let groupInfo = { originFieldName: "date", dateGroups: [{ by: GC.Pivot.DateGroupType.quarters }, { by: GC.Pivot.DateGroupType.years }] };
pivotTable.group(groupInfo);
pivotTable.add("Years", "Years", GC.Spread.Pivot.PivotTableFieldType.columnField);
When ungrouping date groups, all of the dates with the same origin field will be removed, and the origin field revert to the normal date.
Grouping Text
Users may want to group specific text items to differentiate from the rest of the data. To do this, the user can create a group of text values. When adding a text group, a new field will be created. The field's name is the fieldName given in groupInfo.textGroup. You can use the new field as a group field. This example shows a new group being added as a column field:
let groupInfo = { originFieldName: "country",textGroup: {
    fieldName:"country1",
    groupItems:{
        group1:["Spain","China","Australia","Egypt"],
        group2:["Germany","Republic of Korea","South Africa"]
    }
} };
pivotTable.group(groupInfo);
pivotTable.add("country1", "country1", GC.Spread.Pivot.PivotTableFieldType.columnField);
When ungrouping text groups, the field will be removed when ungrouped.
Grouping Numbers
Grouping numbers with SpreadJS will add a number group. The origin field specified in the groupInfo will be changed to the group field to use as such. Grouping numbers appear as follows:
let groupInfo = { originFieldName: "id",numberGroup: { by: 100 } };
pivotTable.group(groupInfo);
When ungrouping number groups, the field will revert to the normal number field.
Pivot Table Theme
SpreadJS’s PivotTable provides 85 predefined themes - 29 light, 28 medium, and 28 dark.
You can apply the pivot table theme when adding the pivot table, or you can use the theme function.
let pivotTable = sheet.pivotTables.add("PivotTable", table.name(), 0, 0, GC.Spread.Pivot.PivotTableLayoutType.outline, GC.Spread.Pivot.PivotTableThemes.medium2);
//pivotTable.theme(GC.Spread.Pivot.PivotTableThemes.dark2);
//pivotTable.theme("dark2");
Choosing the right theme improves the appearance of your pivot table and offers a more professional presentation of data for the end receivers of your report. Check out SpreadJS’s online demo here to see for yourself.
You can apply a pivot table style to highlight any specific data. The style method can apply styles to row, column, value, and label fields. For example, the following code snippet applies a style to the value fields.
// Get the pivot area
let labelPivotArea = {
    dataOnly: true,
    references: [{
      fieldName: "Values",
      items: ["Global_Sales", "NA_Sales"]
    }]
};

// Create style
let style = new GC.Spread.Sheets.Style();
style.backColor = "#82bc00";

// Set pivot style
pivotTable.setStyle(labelPivotArea, style);
This code will highlight the value fields “Global_Sales”, “JP_Sales”, and “NA_Sales”:
With this support, JavaScript developers can customize and apply their own rules, styles, and formatting to certain pivot table fields; check out SpreadJS’s online Pivot Style demo for more information.
Pivot Table AutofitColumn
SpreadJS’s pivot table offers an AutofitColumn function that adjusts the pivot table's column width to accommodate the longest value in a field. Overall, it is a helpful function and convenient when working with long, text-based fields.
// Auto fit Pivot Table columns
pivotTable.autoFitColumn();
The GIF below demonstrates this function; when the page reloads, the autoFitColumn function is invoked:
Pivot Table Slicers
Pivot Table Slicers are an interactive visual control that allows users to filter and manipulate data within a pivot table. They provide a user-friendly way to narrow down the data displayed in a pivot table by selecting specific criteria, such as dates, categories, or other relevant dimensions. Users can quickly analyze and explore data subsets using slicers without modifying the underlying pivot table structure. SpreadJS supports both the Item Slicer and Timeline Slicer.
|
PivotTable Item Slicer 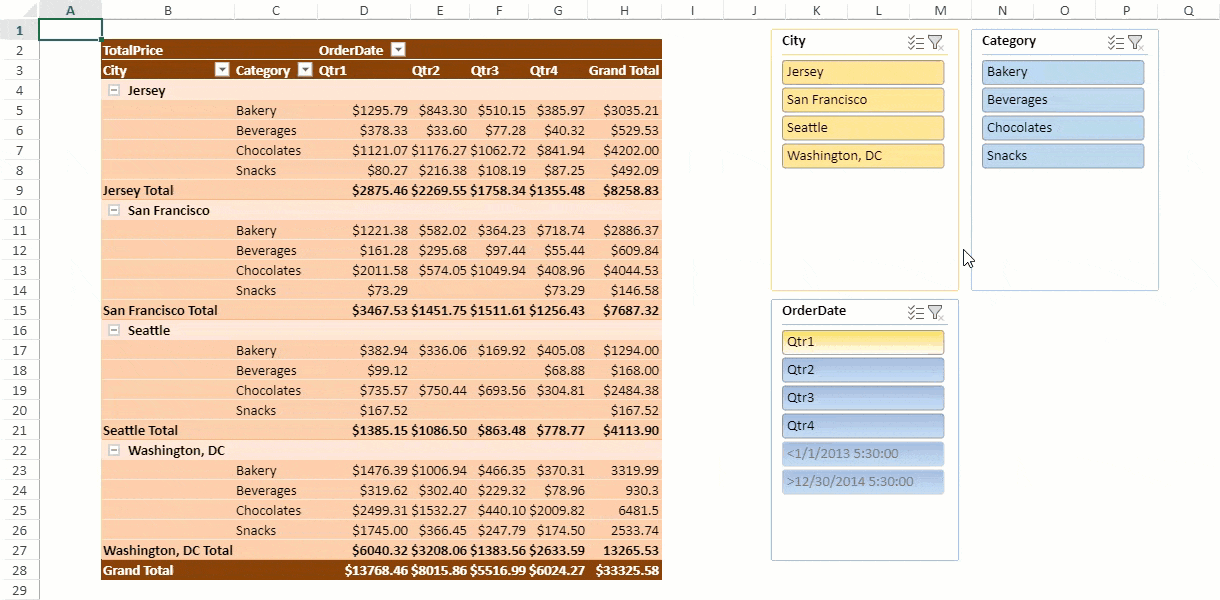 |
PivotTable Timeline Slicer  |
Check out SpreadJS’s JavaScript Slicer demo to try the slicers for yourself.
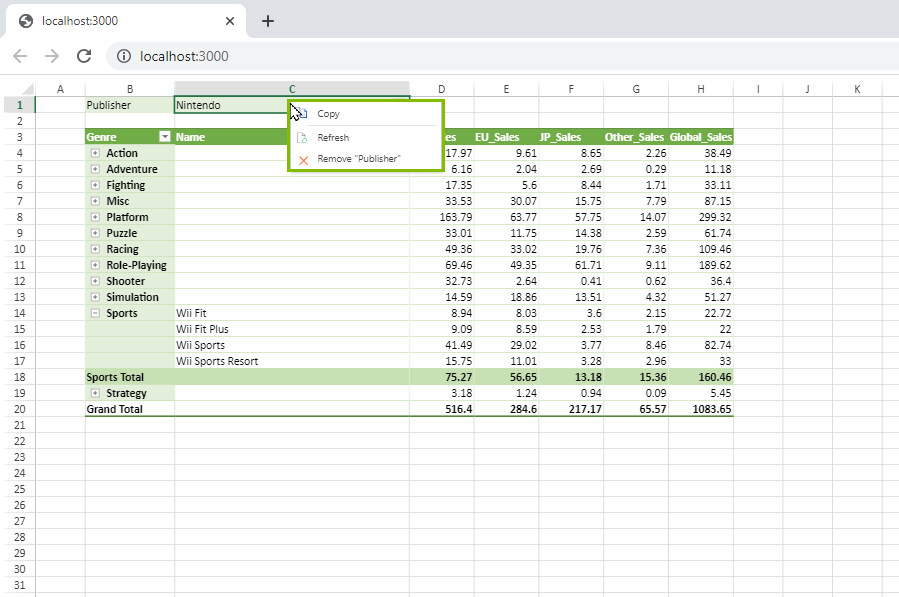
Pivot ContextMenu
SpreadJS offers a Pivot ContextMenu that empowers users to perform various actions on pivot tables effortlessly. This feature allows users to sort data, rearrange field headers, and personalize the control by expanding or collapsing field values. The Pivot ContextMenu provides a user-friendly and compact interface to modify the appearance of pivot table data.
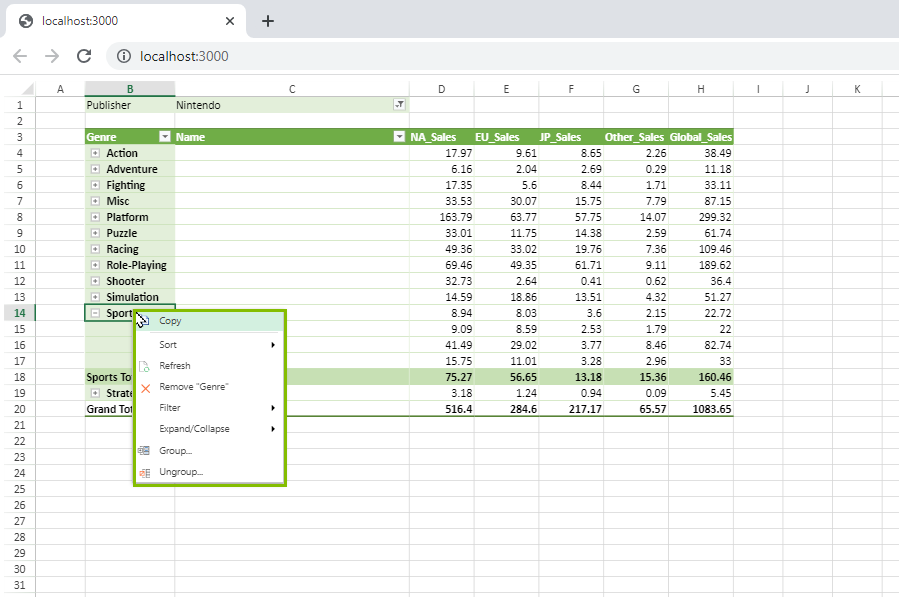
When interacting with different parts of a pivot table and then right-clicking, SpreadJS presents distinct context menu options. Here are some of the JavaScript Pivot Table Context Menus:
|
The page area
|
The header area
|
|
The data area
|
The Grand Total area
|
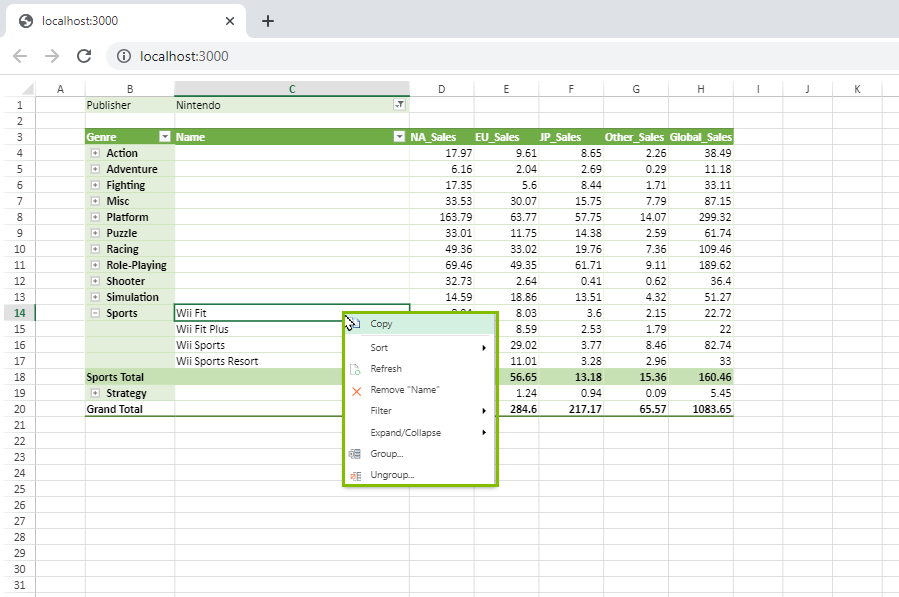
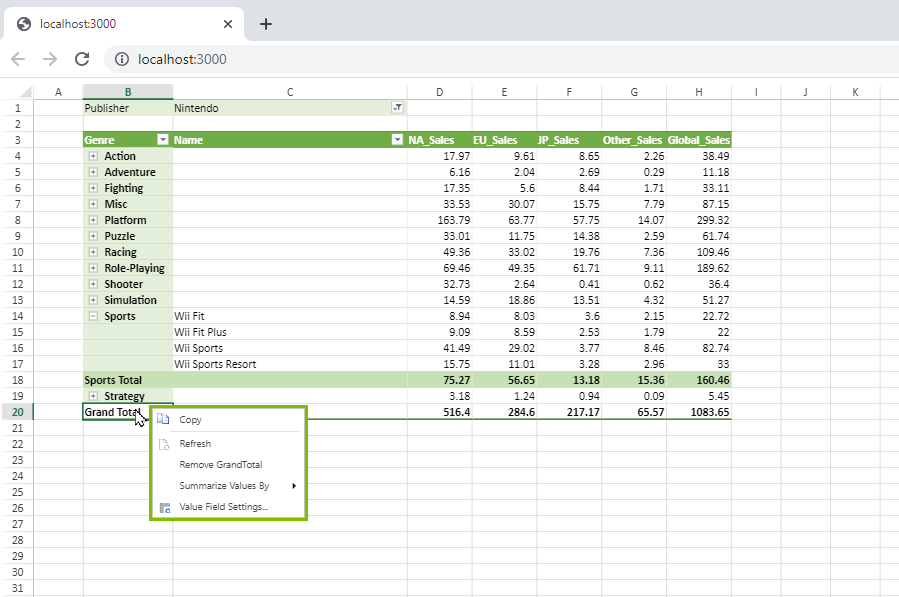
Users can also format values with given formats or customized ones by choosing the “Value Field Settings..." option from the data area or the Grand Total area context menu to open the dialog window.
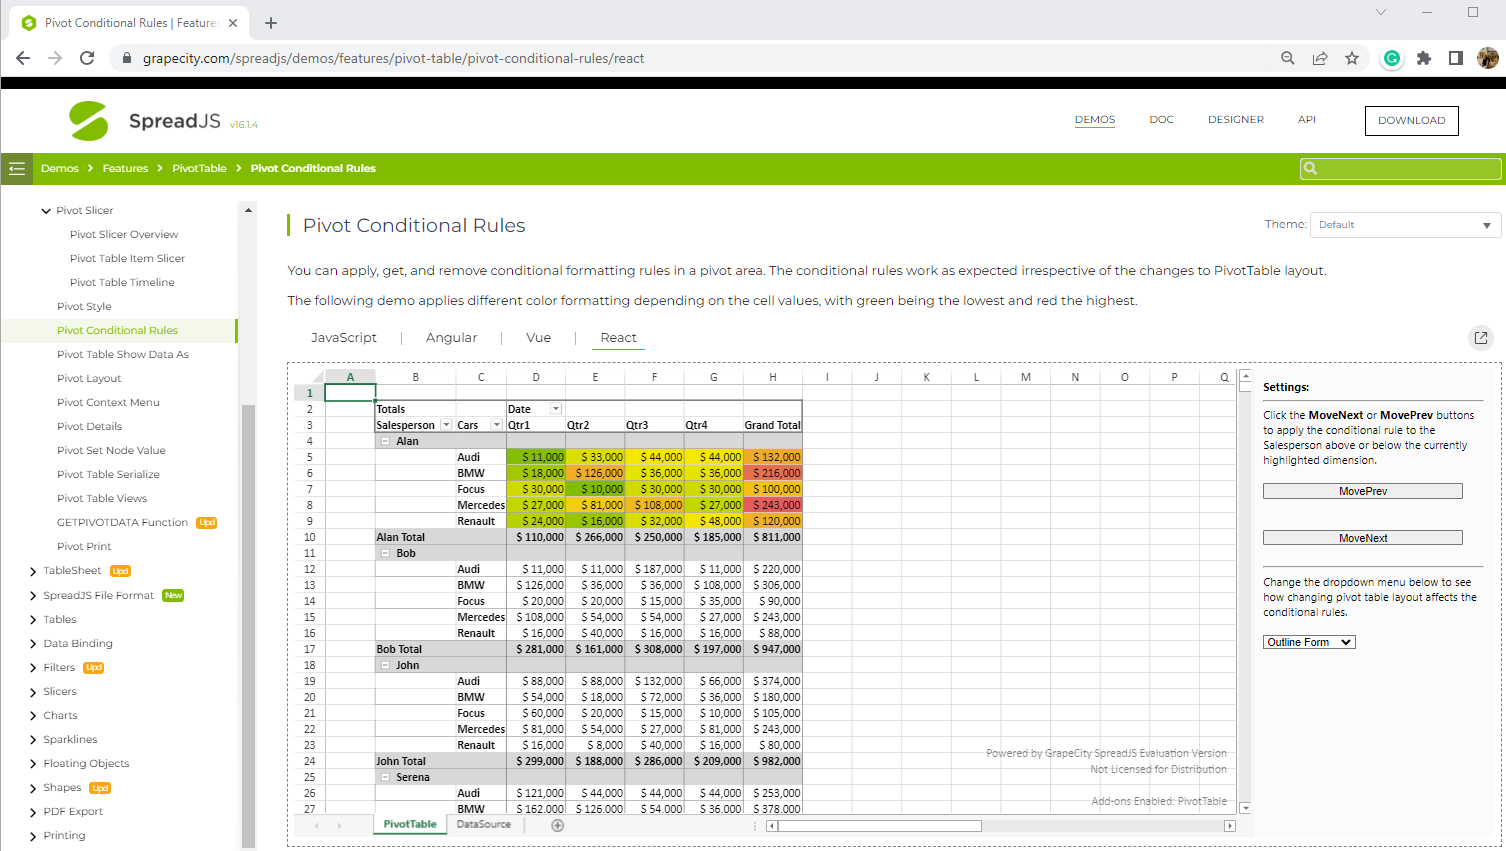
Pivot Conditional Formatting
Conditional Formatting is a powerful tool that allows you to quickly highlight data fields, making it easier to identify outliers or refine your results. In a pivot area, you have the flexibility to apply, retrieve, and remove conditional formatting rules. These rules remain in effect even if you make changes to the PivotTable layout.
You can apply Conditional Formatting to the SpreadJS’s Pivot Table using the addConditionalRule method.
Check out SpreadJS’s online demo. This demo applies different color formatting depending on the cell values, with green being the lowest and red the highest.
Benefits
Now that you have seen how SpreadJS can be used to add PivotTables to your application, we can go through some of the benefits of doing so:
Interactive Data Analysis
With a few lines of code or a couple of clicks in the Designer, a SpreadJS Pivot Table can reduce hours of work to only a few minutes. Decrease potential errors by manually creating calculated fields, groups, and filters–then let SpreadJS Pivot Tables do the rest. Focus more time on interpreting and analyzing data efficiently rather than manually creating your data breakdowns. You can use the pivot table panel to seamlessly drag-and-drop fields between the different areas and customize how the pivot table displays your data.
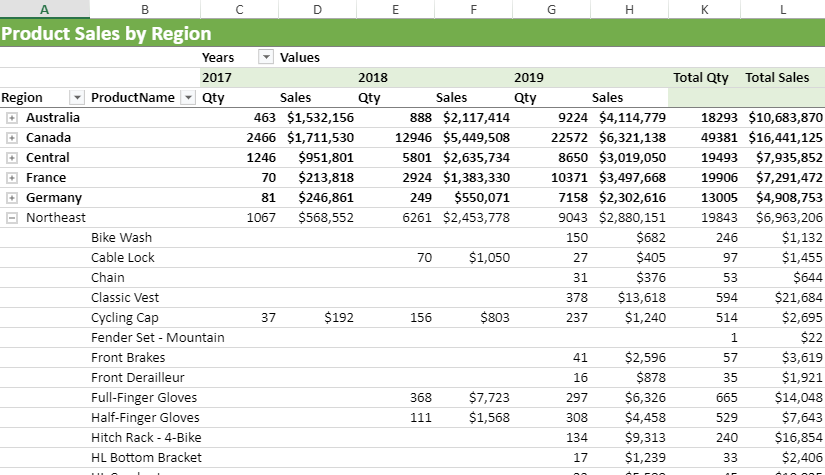
Reviewing Product Sales
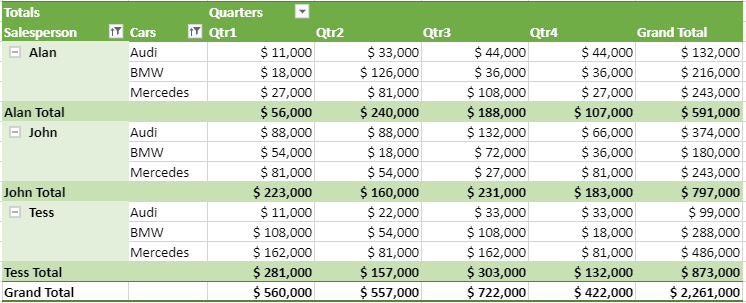
Reporting sales numbers can be daunting, especially with thousands of records, products, offices, and employees, and that's where SpreadJS Pivot Tables help. A pivot table can summarize a large amount of raw data in more understandable terms. For example, SpreadJS Pivot Tables would allow you to see the sales of a particular salesperson during a specific period of time. Easily report actual sales numbers against a target, analyze employee commission levels, and view reseller transactions.
You can instantly aggregate sales numbers by different fields and filters, giving you a clear and concise view of the data you need. In this case, you can import sales data for multiple stores, filter by promotions, and separate them into different sales channels to get a breakdown of your sales data.
FinTech
Create income statements, balance sheets, and profit and loss statements easily with SpreadJS Pivot Tables. You can also emphasize profit subtotals, including gross and operating subtotals. Create custom groupings that might not be available in your source data to provide the exact data breakdown you need. Include calculated fields to summarize large amounts of data in concise, customizable tables.

Marketing
With SpreadJS Pivot Tables, you can track your company's growth with various KPIs. You can also create a table focusing on multiple marketing strategies and inputs, including paid advertising campaigns, social media engagement, click-through, and conversion rates.
Visualize the analysis of advertising campaigns by geography, date ranges, and channels, and provide a breakdown of the results in an informative pivot table. For example, you could check product categories and see which categories customers purchase the most. Filter those orders by the corresponding promotion to help report on the promotion's effectiveness.

Budgeting
SpreadJS Pivot Tables make creating budgets simple and straightforward. Create detailed pivot tables to compare budgets for the unique aspects of your business, such as tracking actual expenses compared to projected values. Summarize expenditures for different stores and product lines by months, categories, or any other fields with a simple interface–easily dragging and dropping fields to fit your requirements. Analyze and categorize the store spending and compare the year-over-year values.

Ready to Get Started? Download a free trial of SpreadJS today!
We hope you enjoyed learning how to create and customize JavaScript Spreadsheet Pivot Tables. This article only scratches the surface of the full capabilities of SpreadJS, the JavaScript spreadsheet component.
Review the documentation to see some of the many available features, and check out our online demos to see the features in action and interact with the sample code. Integrating a spreadsheet component into your JavaScript applications allows you to customize your users' experience and provide them with familiar spreadsheet functionality.
Tags:
Related Blogs
Try Our JavaScript Spreadsheet Components
SpreadJS Resources

Kevin Ashley