Introduction to FlexPivot Range Group (ComponentOne for WinForms)
Introducing Data Range Groups in Pivot
Organizing data into groups helps the end-user better understand, navigate, and analyze data. FlexPivot for WinForms allows a user to group data based on specific conditions.
ComponentOne for WinForms 2019v2 release announces 'Data Ranges' in FlexPivot. Data Ranges allows grouping by in-built criterias and also provides option to create custom criteria for grouping data. Using this feature, data in any pivot field (be it of type DateTime, string or int etc] can be grouped.
In addition to the facility to define range criterias in code, it also allows setting the criterias at run time.
To enable this feature, C1.DataEngine.4 assembly has been enhanced with class C1.FlexPivot.RangeInfo. The class exposes RangeType enum property that defines the type of range to create for the field data.
public enum RangeType
{
        None = 0,
        Custom = 1,
        Numeric = 2,
        Format = 3,
        AlphabeticalIgnoreCase = 4,
        AlphabeticalCaseSensitive = 5,
        Quarter = 6,
        Week = 7,
        FiscalYear = 8,
        FiscalQuarter = 9,
        FiscalMonth = 10,
        FiscalWeek = 11
}
Select any enum based on the field type. Like, if the field is of numeric type choose Numeric or if the field contains string type data choose AlphabeticalCaseSensitive or AlphabeticalIgnoreCase. Not to mention ‘Custom’ enum value would work with any field type.
Implementing Group Ranges in Pivot
Consider, an organization wants to analyze the purchasing power of people in each country based on its Gross National Income Per Capita. The company wants to know this distribution in order to maximize its profit by adjusting its product marketing strategies.
In this case, the company can group the data by ‘income group’ to identify which countries are high income countries, which are upper middle income and so on. But to get a deeper insight about how wealthy or poor a country is, it can further dissect the countries into numeric ranges of specific interval to obtain income break-down. This will help the organization advertise its products country-wise in accordance with the income level of the citizens.

Here, the first column represents income groups whereas the second column breaks down the specific income group into numeric ranges of $1500.
This will help the organization alter their marketing strategies to target high-income countries for its expensive products. Similarly, cheaper products can be advertised more in countries with low per capita income.
Such a scenario is very easy to achieve through C1FlexPivot. To see how, the following portion of the article discusses its implementation using C1FlexPivot.
We’ll be dividing the complete implementation in following parts:
-
Collecting data and binding pivot
-
a.) Adding fields in pivot grid at run time
b.) Adding fields in code
-
a.) Setting group range at run time
b.) Setting group range in code
1. Collecting Data and Binding Pivot
To show how effortlessly you can use FlexPivot to analyze complex data, we will display data for ‘country classifications by income level’ from the WorldBank. The countries taken for consideration are those whose data is available for each year since 2004 (with 2004 being the reference year for comparisons).
To reflect this data in a pivot, we need to have a blueprint of the data that we can bind our pivot to. We will create following class for this:
public class Country
{
    public string Name { get; set; }
    public string Code { get; set; }
    public string Region { get; set; }
    public double IncomePerCapita { get; set; }
    public string PreviousIncomeGroup { get; set; }
    public string IncomeGroup { get; set; }
    public Country()
    {
        Name = "";
        Code = "";
        IncomeGroup = "";
        IncomePerCapita = 0;
    }
}
With FlexPivot, to add data and show data fields in pivot panel, setting the DataSource property is enough.
c1FlexPivotPage1.DataSource = DataLoader.Import(year);
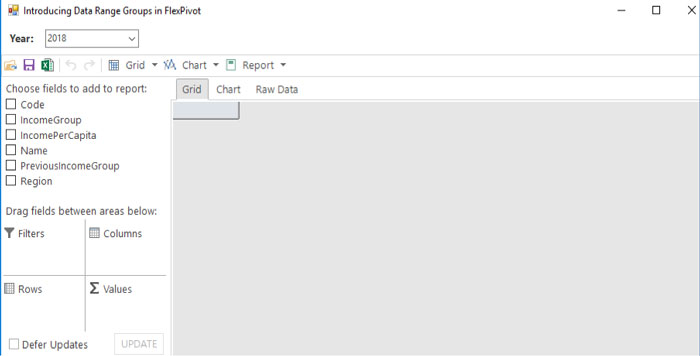
2. Adding Fields in Pivot Grid
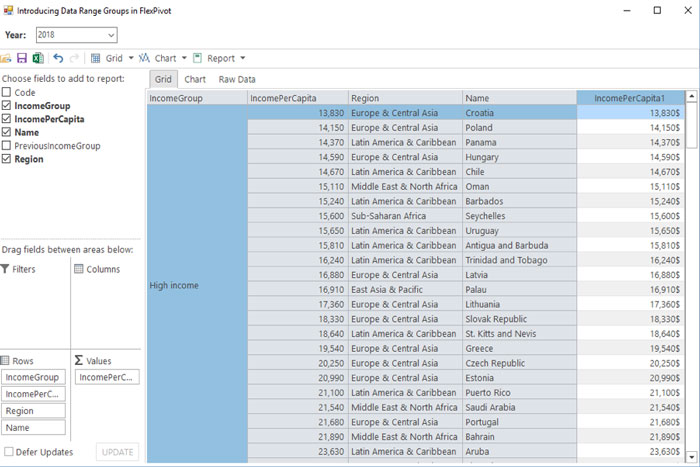
Once the pivot is bound and pivot panel is filled with fields, we can add any field to RowFields, ColumnFields or ValueFields collection based on whether the field is needed as row, column or cell values respectively.
a.) At run time
Choose 'IncomePerCapita' field and drag drop it to ValueFields collection. Similarly, drag drop 'IncomeGroup', 'IncomePerCapita', 'Region' and 'Name' fields to RowFields collection.
b.) In code
RowFields, ColumnFields and ValueFields collection are available in FlexPivotPage’s FlexPivotEngine class. Call their Add method to add fields in them.
var pivotEngine = this.c1FlexPivotPage1.FlexPivotEngine;

pivotEngine.RowFields.Add("IncomeGroup", "IncomePerCapita", "Region", "Name");

pivotEngine.ValueFields.Add("IncomePerCapita");
3. Setting Group Range
To break down the data of any field in group ranges, set its Range.RangeType property considering the type of field.
a.) At run time
To group the ‘IncomePerCapita’ field, right click the column in pivot grid and select ‘Field Settings’ option from the context menu. Navigate to 'Format' tab, select 'Number', check the 'Group by' checkbox and set the value to 1500.
b.) In code
To group the ‘IncomePerCapita’ field, set its Range.RangeType property to Numeric.
Now, to break down the income in intervals, set Range.NumericStep property to 1500
pivotEngine.RowFields[“IncomePerCapita”].Range.RangeType = RangeType.Numeric;
pivotEngine.RowFields[“IncomePerCapita”].Range.NumericStep = 1500;
Finishing the above steps, pivot grid will have an income column broken down into numeric ranges with interval $1500.
Through this column organization can analyse the purchasing power of people in each country and accordingly adjust their marketing strategies.
Other properties available in pivot’s range groups feature:
The requirement scenario demonstrated above applies ranges to numeric field by choosing Numeric as RangeType and setting NumericStep property.
Similarly, ranges can also be applied to fields of other type through following properties also available in C1.FlexPivot.RangeInfo class:
-
If RangeType chosen is among Quarter, Week, FiscalYear, FiscalQuarter, FiscalMonth or FiscalWeek, optionally set FiscalYearFirstMonth property to define which month shall be considered as first month of fiscal year.
-
If RangeType chosen is Quarter, Week, FiscalYear, FiscalQuarter, FiscalMonth or FiscalWeek, optionally set FiscalYearShift property to shift fiscal year by +/- 1.
-
If RangeType chosen is Custom, handle CustomRange event to create your own criteria for grouping. Use CustomRangeEventArgs GroupValue for identifying the range group and set CustomRangeEventArgs Value to your own custom value.
-
Optionally set Format property to specify how the range values should show up in pivot grid.
We hope you like the new data range group feature. We believe it is essential to organize data and is a very useful feature.
We also promote you to share your ideas on how you’re implementing grouping in your application.
If you have any questions about this tutorial, please leave us a comment. Additionally, if you have a request for a specific demo, be sure to leave a comment below.
Happy development using ComponentOne!

Ruchir Agarwal