Map Visualizations…without Maps!
Did you know that you can create a flashy data visualization on a map without needing a real mapping control? Yes - you can instead use a chart control. After all, geo coordinates are simply two values (latitude and longitude) just like x and y. All you need is a finely scaled background image of the map region you wish to visualize on, and the chart control will plot your data. In this blog post I show how you can create a map visualization using the ComponentOne Chart control for XAML (WPF, Silverlight, Windows Phone, and Windows Store). I’ve provided two complete samples you can download at the bottom, WPF and WinRT XAML (C-Sharp).
Background
Many dashboards and business applications use professional map controls (i.e. Esri) to simply visualize their data on a map. For instance, a common usage scenario is to display markers for a collection of locations on a map control. Uses like this barely scratch the surface of what you could be doing with a big mapping control. It would be like playing Tetris on your Xbox One. Chart controls, of course, do not offer all of the features and benefits of a mapping control, such as geocoding. But they do usually offer better data binding features and most importantly they do not require internet connectivity! Overall, think of a chart map as lighter, flatter, and in most cases much faster. For my sample I will create the following bubble chart on a map using the C1Chart control. 
Creating the Map Image
You need to find or create the map of the region you wish to plot against. Then you need to determine the bounding latitude and longitude of your region. Keep in mind that this image will be placed behind the chart’s plot area so it’s important to know the exact latitude and longitude that mark the boundaries of the image. You will use those values to mark the limits of the chart axes later. For my chart I will use the entire world map as seen here:  You can determine the exact latitude and longitude by comparing it to a map that has these lines already marked.
  In my case, my map runs exactly from (-180, -90) to (180, 90). You can verify how accurate your map image will be by superimposing it over a lat/long map of the same region.
 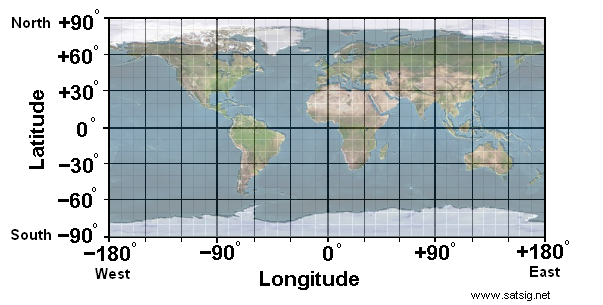 Of course, the accuracy of your chart depends on the accuracy of your measurements in this stage. You may not need it to be super accurate, but you can certainly make it extremely accurate if you want. If you are using a map image from the Web, be sure it’s not copy protected. To help you find the lat/long of locations you can use free sites like Google Maps. http://itouchmap.com/latlong.html.
Setting the Chart Plot Background
Next we need to set our image as the plot area background in our chart. So let’s add a C1Chart control to the page and then add the map image to the project as ‘Resource’ (WPF) or as ‘Content’ (WinRT). Here is the XAML if you’re working in WPF:
<c1:C1Chart x:Name="mapChart">
    <c1:C1Chart.View>
        <c1:ChartView>
            <c1:ChartView.PlotBackground>
                <ImageBrush ImageSource="Resources/world_map.jpg"/>
            </c1:ChartView.PlotBackground>
        </c1:ChartView>
    </c1:C1Chart.View>
    <c1:C1ChartLegend Position="Right" VerticalContentAlignment="Center"/>
</c1:C1Chart>
Here is the XAML if you’re working in WinRT:
<c1:C1Chart x:Name="mapChart">
    <c1:C1Chart.View>
        <c1:ChartView>
            <c1:ChartView.PlotBackground>
                <ImageBrush ImageSource="ms-appx:///Assets/world_map.jpg"/>
            </c1:ChartView.PlotBackground>
        </c1:ChartView>
    </c1:C1Chart.View>
    <c1:C1ChartLegend Position="Right" VerticalContentAlignment="Center"/>
</c1:C1Chart>
Setting the Chart Axes
Next, let’s set the chart axis limits in code so we can see our map begin to take shape. The X axis displays the longitude values so I set my min/max to -180/180. For latitude I set my min/max to -90/90.
// setup chart
mapChart.BeginUpdate();
mapChart.View.AxisX.Min = -180;
mapChart.View.AxisX.Max = 180;
mapChart.View.AxisY.Min = -90;
mapChart.View.AxisY.Max = 90;
mapChart.EndUpdate();
 I can tell that this is pretty accurate because Pittsburgh, Pennsylvania is approximately at -80/40. But if you’re not sure your map is accurately positioned you should calibrate it now by adjusting axis limits or resizing your map image. Now, in the final map we will hide the axes because we typically do not show lat/long values in a map visualization, nor do we show the grid lines. For now it’s just so we can verify the accuracy of our plotting.
Adding Data to the Chart
Up to this point we’ve created the chart and configured its axes and plot background for the map. Now we just need to add data to the chart. A good chart type for mapping is a bubble chart which shows 3 dimensions of data (x, y and value). In map visualizations we are typically graphing at least 3 dimensions of data (longitude, latitude and some value) so that’s why a bubble series makes the most sense. So we should set the ChartType property as such.
mapChart.ChartType = C1.Xaml.Chart.ChartType.Bubble;
Consider we have a list of sales data and we wish to group it on Region and plot the aggregated totals for each region on our map. The following code creates a grouped data set from a simple list of data. It uses LINQ to perform the grouping and returns a List of BubbleSeries. BubbleSeries is a class from the C1.Xaml.Chart namespace as it defines a bubble chart series.
public List<BubbleSeries> SalesByRegion
{
    get
    {
        // group all sales by category
        IEnumerable<IGrouping<Region, SampleDataItem>> query = from sale in _allSales
                                                               group sale by sale.Region;
        List<BubbleSeries> values = new List<BubbleSeries>();
        double runningTotal = 0;
        foreach (var region in query)
        {
            runningTotal = 0;
            BubbleSeries bs = new BubbleSeries();
            bs.SizeValues = new DoubleCollection();
            bs.Values = new DoubleCollection();
            bs.XValues = new DoubleCollection();
            //get lat/long for series
            SampleDataItem firstItem = region.First<SampleDataItem>();
            bs.XValues.Add(firstItem.Region.Longitude);
            bs.Values.Add(firstItem.Region.Latitude);
            bs.Label = firstItem.Region.Name;
            // calculate total for group
            foreach (SampleDataItem item in region)
            {
                runningTotal += item.SaleAmount;
            }
            bs.SizeValues.Add(runningTotal);
            values.Add(bs);
        }
        return values;
    }
}
In the code above you can see where i'm mapping Latitude to Y, Longitude to X and the total sales value to my bubble Sizes collection. The data object includes hard coded lat and long values for each sales region. I’m not going to show all of the code required to make the above property work, you can download the full sample for that below. The useful thing to get out of it is the grouping approach used. To add these bubble series to our chart, we will iterate the list and add them one by one.
foreach (C1.Xaml.Chart.BubbleSeries bs in dataSource.SalesByRegion)
{
    bs.PointTooltipTemplate = this.Resources["lbl"] as DataTemplate;
    mapChart.Data.Children.Add(bs);
}
Notice here that I’m also setting the PointTooltipTemplate to each bubble series. This is giving me the tooltip at run-time which displays the underlying value. The DataTemplate “lbl” is defined as follows:
<!-- data label tooltip -->
<DataTemplate x:Key="lbl">
    <TextBlock FontSize="12" Margin="0" Foreground="Black">
            <Run Text="{Binding Path=Series.Label}" />
            <LineBreak />
            <Run Text="$" />
            <Run Text="{Binding Path=[SizeValues]}" />
    </TextBlock>
</DataTemplate>
Here we are binding some regular TextBlock elements to values from our chart’s DataPoint class. Series.Label returns the name of the series as it appears in the legend. [SizeValues] with square brackets is returning the bubble size, or value. For more information on creating data labels and tooltips for C1Chart, check out my video tutorial here.
Styling the Chart
There are a few more things we should do to style our chart appropriately. The following code will remove all the visual parts of the axes so that we’re left with just the plot area.
// hide axis line
mapChart.View.AxisX.AxisLine = new Windows.UI.Xaml.Shapes.Line() { StrokeThickness = 0 };
mapChart.View.AxisY.AxisLine = new Windows.UI.Xaml.Shapes.Line() { StrokeThickness = 0 };
// hide axis labels
mapChart.View.AxisX.AnnoPosition = C1.Xaml.Chart.AnnoPosition.None;
mapChart.View.AxisY.AnnoPosition = C1.Xaml.Chart.AnnoPosition.None;

// remove grid lines and tick marks
mapChart.View.AxisX.MajorGridStrokeThickness = 0;
mapChart.View.AxisX.MinorGridStrokeThickness = 0;
mapChart.View.AxisY.MajorGridStrokeThickness = 0;
mapChart.View.AxisX.MajorTickThickness = 0;
mapChart.View.AxisX.MinorTickThickness = 0;
mapChart.View.AxisY.MajorTickThickness = 0;
mapChart.View.AxisY.MinorTickThickness = 0;
Also, choose a color Palette that will look nice on top of the map image you choose. For instance, “Metro” is a very bright palette. Note that if you’re working in WPF then the namespace for C1Chart properties is C1.WPF.C1Chart. 
Conclusion
For the simplest map views in your business apps and dashboards you should ask yourself – do I need a real map control? Or can I get by with just a chart? This exercise was to show how you can use the C1Chart control to create a map visualization. Download ChartMap_WinRT8.1.zip Download ChartMap_WPF.zip

Greg Lutz