Render Millions of Data Points in Charts with WebGL
Our JavaScript chart, FlexChart, uses SVG as its default rendering target. SVG is an excellent choice for many applications and has a lot of advantages:
- It provides high-quality, sophisticated vector 2D graphics that can be customized with CSS.
- Universal and portable format with excellent software support, including the browsers.
- It is quite fast in modern browsers.
Yes, it's fast for many applications. We were even surprised by SVG performance in browsers many years ago, but it is still not fast enough for big data. For example, if we look at a scatter chart, each point is an element in SVG (and actually in the DOM), which needs to be parsed, allocated, added to the visual tree, and rendered. It's not a problem when you have a hundred points, but if there are 100K+ points, it will start to burden the browser.
We live in a world of big data and often want to plot more and more of it. Scatter charts with enormous datasets can be used to visualize and analyze correlations between multiple variables. One of my favorites is the star luminosity diagram.
We need something faster than SVG. What other drawing API's are available for the web? There are Canvas and WebGL. To start, we did a quick performance test for Canvas, but the result was far from impressive, so we decided to try WebGL.
Using WebGL Rendering
WebGL is excellent for quickly drawing things in the browser. Its key characteristics:
- Fastest 2D and 3D graphics for the web at this moment. It is a low-level hardware-accelerated API, and it uses GPU more effectively than other drawing APIs.
- All major browsers support WebGL, even IE11 has 'an experimental' but workable WebGL.
That looks promising, but, of course, there are several drawbacks:
- It provides only fundamental drawing primitives (mostly triangles). There is no text output at all.
- The output is a bitmap that doesn't scale well e.g., for printing or exporting to vector formats.
- It's more challenging to develop and debug, especially compared with SVG. It requires some knowledge of GPU programming, like shaders, transformations, etc.
The first limitation is the most serious one since almost all plots have text elements: legend, labels, titles, etc.
How to Use Hybrid Rendering in JavaScript Applications
Fortunately, we can easily combine both SVG and WebGL drawing techniques:
- Use SVG used for essential chart elements: axes, legend, labels.
- Use WebGL for plotting large amounts of data elements e.g., the points in scatter charts.

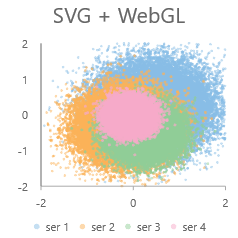
With this approach, we can take the best features from both drawing APIs. In the latest release, we've introduced a new high-performance rendering engine for FlexChart WebGLRenderEngine (wijmo.chart.webgl module). The new engine implements the described 'hybrid' SVG+WebGL drawing. To enable a new engine, you need to set the renderEngine property of FlexChart:
flexChart.renderEngine = new wijmo.chart.webgl.WebGLRenderEngine();
Its performance for a scatter chart with the large dataset is usually 10x-20x faster than SVG, which is a pretty good result. At the same time, the new render engine should be compatible with existing code and CSS styling.
The massive data set is not the only case when WebGL rendering can be useful. The other possible scenarios are an enormous web page with many elements or applications with multiple and/or dynamic charts.
Of course, if you have millions of records to manage, then you likely need a powerful datagrid that can still perform well with that load. Try FlexGrid, our JavaScript DataGrid that virtualizes rendering so that it can handle large datasets. FlexGrid is also available as an Angular DataGrid, React DataGrid and Vue DataGrid.

Alex Trefilov