Excel pivot tables are an invaluable tool to help organize and analyze data in various ways with minimal effort. With SpreadJS, our JavaScript spreadsheet, you can add Pivot Tables to your application. To see how you can use this feature, check out "How to Use Pivot Tables with SpreadJS.” In this blog, we explore different use cases that show how to effectively get the most out of the SpreadJS Pivot Table feature in your application.
Download SpreadJS today and try Pivot Tables for yourself!
Interactive Data Analysis
With a few lines of code or a couple of clicks in the Designer, a SpreadJS Pivot Table can reduce hours of work to only a few minutes. Decrease potential errors by manually creating calculated fields, groups, and filters–then let SpreadJS Pivot Tables do the rest. Focus more time on interpreting and analyzing data efficiently rather than manually creating your data breakdowns. You can use the pivot table panel to seamlessly drag-and-drop fields between the different areas and customize how the pivot table displays your data.

Reviewing Product Sales
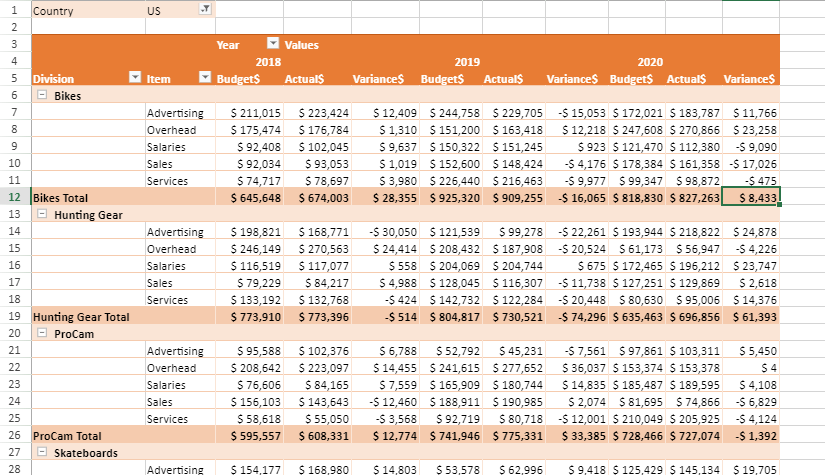
Reporting sales numbers can be a daunting task, especially with thousands of records, products, offices, and employees, and that's where SpreadJS Pivot Tables help. A pivot table can summarize a large amount of raw data in more understandable terms. For example, SpreadJS Pivot Tables would allow you to see the sales of a particular salesperson during a specific period of time. Easily report actual sales numbers against a target, analyze employee commission levels, and view reseller transactions.
You can aggregate sales numbers by different fields and filters instantly–giving you a clear and concise view of the data you need. In this case, you can import sales data for multiple stores, filter by promotions, and separate them into different sales channels to get a breakdown of your sales data.

FinTech
Create income statements, balance sheets, and profit and loss statements easily with SpreadJS Pivot Tables. You can also emphasize profit subtotals, including gross and operating subtotals. Create custom groupings that might not be available in your source data to provide the exact data breakdown you need. Include calculated fields to summarize large amounts of data in concise, customizable tables.
Marketing
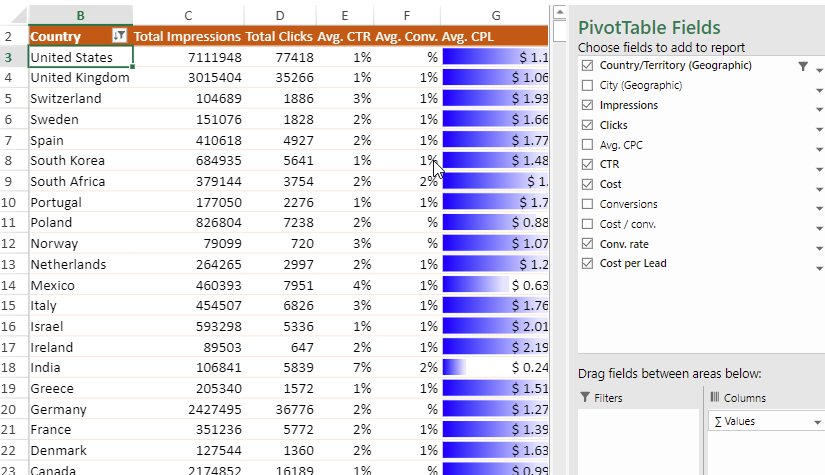
With SpreadJS Pivot Tables, you can track your company's growth with various KPIs. You can also create a table focusing on multiple marketing strategies and inputs, including paid advertising campaigns, social media engagement, click-through, and conversion rates.
Visualize the analysis of advertising campaigns by geography, date ranges, and channels, and provide a breakdown of the results in an informative pivot table. For example, you could check product categories and see which categories customers purchase the most. Filter those orders by the corresponding promotion to help report on the promotion's effectiveness.
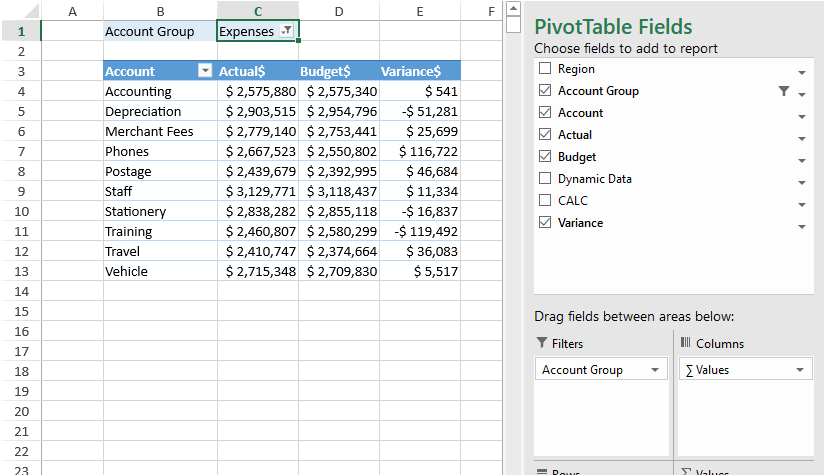
Budgeting
SpreadJS Pivot Tables make creating budgets simple and straightforward. Create detailed pivot tables to compare budgets for the unique aspects of your business, such as tracking actual expenses compared to projected values. Summarize expenditures for different stores and product lines by months, categories, or any other fields with a simple interface–easily dragging and dropping fields to fit your requirements. Analyze and categorize the store spending and compare the year-over-year values.
These are just a few use cases for pivot tables, but the possibilities are endless! To see how to assemble the code for all of these different examples, please download the sample here.
To run the sample, simply extract it and run:
npm install @grapecity/spread-sheets @grapecity/spread-sheets-pivot-addonDownload SpreadJS today and try Pivot Tables for yourself!
Tags:
Related Blogs
Try Our JavaScript Spreadsheet Components
SpreadJS Resources

Kevin Ashley