Dynamic Array Overview
Dynamic Arrays are a very powerful feature of SpreadJS that allows you to automatically calculate and display values into multiple cells based on a formula entered in a single cell.
SpreadJS supports the following built-in dynamic array formulas:
- FILTER - Filters a range of data based on the criteria you defined.
- RANDARRAY - Returns an array of random numbers.
- SEQUENCE - generates a list of sequential numbers in an array, such as 1, 2, 3, 4.
- SORT - Sorts the contents of a range or array.
- SORTBY - Sorts the contents of a range or array based on the values in a corresponding range or array.
- UNIQUE - Returns a list of unique values in a list or range.
- The implicit intersection operator @: Returns a single value using logic known as an implicit intersection.
The Spill Range Operator # can reference the entire spill range:
- When you're dealing with spilled array functions, it's possible to reference the entire spill range by placing the spilled range operator (#) after the range.
**Along with built-in dynamic array formulas, SpreadJS also supports custom dynamic array formulas where a user can create a custom function and use it in a dynamic array formula.
---
When using SpreadJS you can activate the Dynamic Array functionality by setting the flag allowDynamicArray = true;
Below is the javascript code:
// 1st way:
var workbook = new GC.Spread.Sheets.Workbook(document.getElementById("ss"), { sheetCount: 1, allowDynamicArray: true});
// 2rd way:
var workbook = new GC.Spread.Sheets.Workbook(document.getElementById("ss"));
workbook.options.allowDynamicArray = true;
And if you are using our Designer component, follow the steps below:

- Go on Settings
- Click on Calculation
- Select General
- Check "Allow DynamicArray"
- Click OK
Learn more on data analysis and extractions with Dynamic Arrays in a JavaScript Spreadsheet Component here.
Dynamic Arrays Examples
Below there are some examples of how you can bring volatility to your javascript applications using Dynamic Arrays on SpreadJS.
Amortization Schedule
Loan Amortization calculations are very useful in a range of FinTech applications. However, it might be tricky to update an amortization schedule when the number of periods changes. That is, you may want to see it for a loan with 360 months, and then update it for a loan with 180 months, and so on. As the number of periods changes, so does the number of lines to be displayed. For this reason, there might be the need to have various conditional formatting rules. That's not the case when you are using dynamic arrays: You can create a Loan Amortization Schedule with just 5 formulas.
Consider the below scenario:

Without dynamic arrays, we needed to edit formulas, hide or unhide rows, or fill formulas down in every row depending on the time term. With SpreadJS Dynamic Arrays functionality we will have to use only one formula to calculate each of the term outputs, saving in this way memory and calculation power.
- Period - The Period column simply needs to start at 1 and end at the number of months entered. We will use the SEQUENCE function for this.
=SEQUENCE(months)
- Interest - we’ll use the IPMT function to calculate the interest for each period. Via Dynamic Arrays as an input, we will pass a spilled range#B7 instead of having to write the formula for each row.
=-IPMT(rate/12,B7#,months,amount)
- Principal - same logic as per interest calculation but we will have to use PPMT function.
=-PPMT(rate/12,B7#,months,amount)
- End Balance - to calculate the ending balance for any given period, we’ll use the CUMPRINC function which computes the cumulative principal paid for any period having the SEQUENCE function as an argument.
=amount+CUMPRINC(rate/12,months,amount,1,SEQUENCE(months),0)
- Start Balance - using spilled ranges we can find the starting balance writing only the below formula:
=E7#+F7#
And in no time you will have ready your Amortization Schedule.

If you try to change the Amount, Interest Rate, or Time period (months), the result will change accordingly without you having to update anything.
Top N Report
This example is a pretty generic one. Basically what we want to achieve is retrieve N Top record from a data set based on a certain condition, a very useful thing when having to write interactive reports and dashboards. Dynamic arrays help us achieve this in an easy and quick way.
As a dataset, we have a table called tblSales. What we want to do is extract a list of N Salespersons based on their Yearly Sales. The user will enter the number N on F5.
- Select cell F9 and enter the following formula:
=IFERROR(SORT(FILTER(tblSales,tblSales[[#Data], [ Sales ]]>=LARGE(tblSales[[#Data], [ Sales ]],F5)),2,-1),"")
This formula finds the N-th largest item on the Sales column and gets all the items from the table that have Sales larger or equal with it. In the end, everything is sorted in a descending order (-1) taking the second column as the sort index.

In addition, we will include a check using the COUNT function to determine if the user has selected more entries than the list can provide.
- Select F6 and enter Formula: =IF(F5>COUNT(tblSales[[#Data], [ Sales ]]),"Incorrect. Type a smaller number","")

To make the error message more visible we have used RED as the text color.
Interactive Chart
Next, there is an example of how we can use dynamic arrays to create a dynamic chart that displays only what the user wants to see, without manual filtering and row hiding.
This is especially useful when creating dashboards that include interactive charts depending on a selection.
Below is the table that contains a Personal Expense Budget.
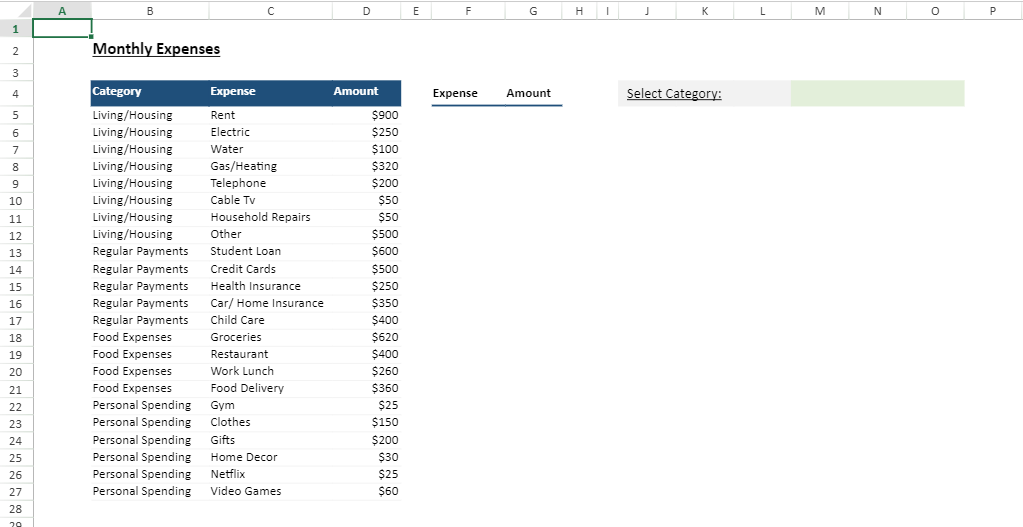
What we would do is have a dropdown at M4 that would contain all the categories and when the user chooses a particular category, the table located at cell F4 containing Expenses and Amounts changes as well.
We could create the dropdown using the Date Validation functionality.
- Select M4
- Click on Data -> DataValidation
- Select List for Allow category
- Define Source - You can do that by writing the Categories one by one or by using the UNIQUE formula: =UNIQUE(tblExpenses[Category])

To get the list of Expenses belonging to a particular category, we can use the FILTER function.
- Select F5 and enter Formula:
=IF($M$4="All",SORTBY(tblExpenses[Expense],tblExpenses[Amount],-1),SORTBY(FILTER(tblExpenses[Expense],tblExpenses[Category]=$M$4),FILTER(tblExpenses[Amount],tblExpenses[Category]=$M$4),-1))
What the formula does is: gets all Expenses by filtering those with FILTER function (when All selected, get all expenses) and sort the array by the AMount.
We use the VLOOKUP to get the value of the amount of the Expense located at column F.
- Select G5 and enter Formula:
=VLOOKUP(F5#,tblExpenses[[Expense]:[Amount]],2,FALSE)

Then we assign a name to the array containing the names and the amount of the Expenses, for our ease of use when making calculations. To do that follow the above steps:
- On the Formulas Tab, select Name Manager.
- In the popup click the New button.
- Set the name of the cell.
In our example:
name: exNames; Refer To: =ANCHORARRAY('Interactive Chart'!$F$5) - we can use $F$5# instead of ANCHORARRAY.
name: exAmounts; Refer To: =ANCHORARRAY('Interactive Chart'!$G$5)
These name ranges would be our chart's data source (we could also directly use the formulas).

And voila, we have an interactive chart that changes depending on which Category of the Expenses we want to be shown.

Searchable Drop Down List
When we have a drop-down list with multiple values, it might be difficult to find a certain one. A searchable drop-down list would be a great way to improve the efficiency of finding values.
As a use case, we have a table containing a list of products and their corresponding prices. What we want to achieve is to have a searchable drop-down list on E4 that gets updated every time we change the content there, and displays a list of items that contain those letters anywhere in the product name.

To make a searchable drop-down list, follow the steps below.
- Create a validation table that would contain the list of items that contain the letters written on E4.
To do that select H3 and enter the formula: =IFERROR(SORT(FILTER(B3:B33,ISNUMBER(SEARCH(E4,B3:B33)),"not found")),"not found")
The formula uses SEARCH to search for the word on the product list. SEARCH function returns the index if it finds the word and !VALUEotherwise, that is why we have the list filtered by the ISNUMBER function that gets only the items where we have an index.

- To make our calculations easier and neat we assign a name to the list containing the acceptable values for the dropdown:
Name: ddValid; Refer To: =ANCHORARRAY('Searchable Drop Down List'!$H$3)

If we change the content of cell E4 the Data Validation List will change and by default the content of the list from which we choose the Product.

- In the end, we select the cell F4, and enter formula: =FILTER(TableCustomer[[#Data], [Price]],TableCustomer[[#Data], [Product]]=$E$4,"") to get the price of the product.
That's how we can have a searchable list by just using dynamic array formula and no javascript extra code.
From-To Date Chart
The next sample is a pretty straightforward one. We have a table containing the dates and the conversion rate from USD to EUR. Our objective is to allow the user to select a “from” date (cell F5) and a “to” data (cell G5) and have those dates retrieve the correct dataset for the Currency Conversion chart.

The user would select two dates: fromDate(F5) and toDate (G5), from two dropdowns. TO calculate the dates that will fill the two dropdowns follow the next steps:
- Select O3 and enter the formula : =UNIQUE(tblRates[[#Data], [Date]]) - contains all the dates as in the dataset.
- Select P3 and enter the formula: =FILTER(N3#,N3#>F5,"") - this will contain all the dates from the selected fromDate (cell F5) till the end.
For ease of use we can add two name ranges like below:
- name: fromDate ; Refer To: =ANCHORARRAY('From-To Date Chart'!$O$3)
- name: toDate ; Refer To: =ANCHORARRAY('From-To Date Chart'!$P$3)
These names will serve as the source for the fromDate and toDate dropdowns respectively.

We will use the FILTER function to calculate the dates and rates based on the dates selection from the user.
- For Dates - select K3 and enter the formula: =FILTER(B5:B50,(B5:B50>=F5)*(B5:B50<=G5),"No records found")
- For Rates - select L3 and enter the formula: =FILTER(C5:C50,(B5:B50>=F5)*(B5:B50<=G5),"No records found")

After we need to assign a name to the array containing the Dates and the Rates just like we did for the Dates array, as we would use these names ranges as datasource for our chart. As before select Name Manager and set the names as below:
name: chartDates ; Refer To: =ANCHORARRAY('From-To Date Chart'!$K$3)
name: chartRates ; Refer To: =ANCHORARRAY('From-To Date Chart'!$L$3)

These name ranges would be our chart's data source (we could also directly use the formulas).

The output would be a chart that would show the rates depending on the from and to date selection. Below is a screenshot:

Key Takeaways
To summarise:
- Dynamic Arrays make certain formulas much easier to write. Those allow for simplicity for different use cases as Loan Amortization Schedules.
- The creation of interactive and dynamic charts has never been easier.
- Dynamic Array formulas can be chained (nested) to do things like filter and sort.
- This functionality makes easier the effective utilization of data caches javascript spreadsheets.
- If users want to build cache-friendly data structures that facilitate random access with low memory footprints (compactness), dynamic arrays can be very useful as those have only a small fixed additional overhead for storing information about the size and capacity.
Download a free trial of SpreadJs and discover how easily you can embed Excel-like JavaScript spreadsheets and other business-related functionalities into your enterprise applications.
Contact us to learn more: us.sales@grapecity.com
Tags:
Related Blogs
Try Our JavaScript Spreadsheet Components
SpreadJS Resources

Jola Hoxha